The following is an article produced by a contributing author. Growers Network does not endorse nor evaluate the claims of our contributors, nor do they influence our editorial process. We thank our contributors for their time and effort so we can continue our exclusive Growers Spotlight service.
Editor’s Note: This is a long contributor article, so I have included links to skip to different sections.
- Why is a labeling system needed for cannabis?
- How does the DiscOmic labeling system work?
- References
Why is a labeling system needed for cannabis?
The purpose of a labeling system is to communicate the contents of a product to an interested observer. The observer could be a prospective consumer about to make a purchase or a producer or broker who is negotiating industrial scale purchases and sales of product. In many industries, such as food, labeling conventions have been well-established. The FDA has developed very specific guidelines for foods, showing the now famous “Nutrition Facts” label that displays the three basic biomolecular categories: protein, carbohydrates, and fats. Looking at this label, a person can get a sense of what they are about to ingest. For example butter, olive oil, coconut oil, and avocado are all very high in fats. Wheat, potato, corn, rice, and sugarcane are all almost entirely carbohydrates. Meats and beans have very high protein contents. Most nuts are considered as “superfoods” because they contain an even balance of protein, carbs, and fats. Another example exists in the pharmaceutical industry, which is also regulated by the FDA. The labels for drugs are very different from the food industry. Whereas food represents a living continuum of countless chemical diversity, drugs are designed to ideally have only one or two active ingredients per pill, with the rest made up of an inactive filler. Pharmaceuticals are rather easy to label because all one needs to do is label the dose of the active compound and the consumer knows all they need to know about a particular formulation of a medicine.
Well that’s great, but how does it pertain to cannabis?
Cannabinoid labeling is not the whole issue when labeling cannabis.
How do you use this labeling system?
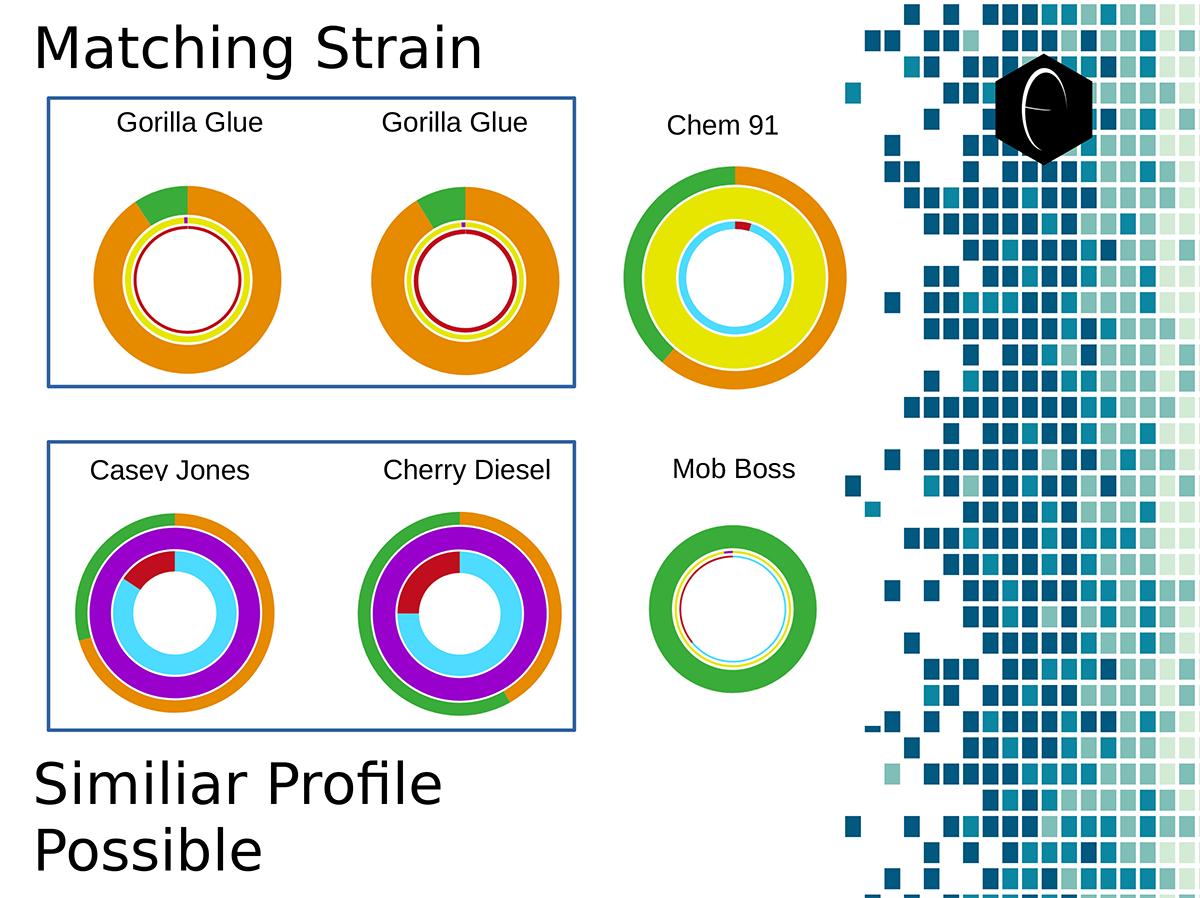 Image showing six different samples that were lab tested for terpenes, and their resulting DiscOmic labels. Note the intuitive nature of recognizing self-similarity makes this system very easy to use. Of the six profiles, two showed noteworthy similarity and have been outlined in blue.
Viewing the illustrations we can see, without knowing or attempting to decipher what the colors and layers in the DiscOmic label signify, an exact match, a close match, and can confidently tell when there is not significant match. This is because DiscOmic was not designed to be used by scientists but everyday cannabis consumers from all walks of life. Those who can most benefit from this intuitive labeling system are cannabis consumers and cannabis producers:
- The consumer can easily memorize a consistent terpene profile in the cannabis they purchase from a dispensary, even as dispensaries routinely run out of certain strains and replace them with new ones, creating a revolving door menu.
- Producers also benefit. A scientifically-backed method of demonstrating strain consistency allows producers to sell their products with more confidence and assure intermediaries of the quality and consistency of their products.
- Producers can also protect themselves from fraudulent competitors who simply re-name inferior cannabis to match the most fashionable strain at the time. Growers and distributors can defend their product from “generic brand” cannabis and protect their strain’s value over time.
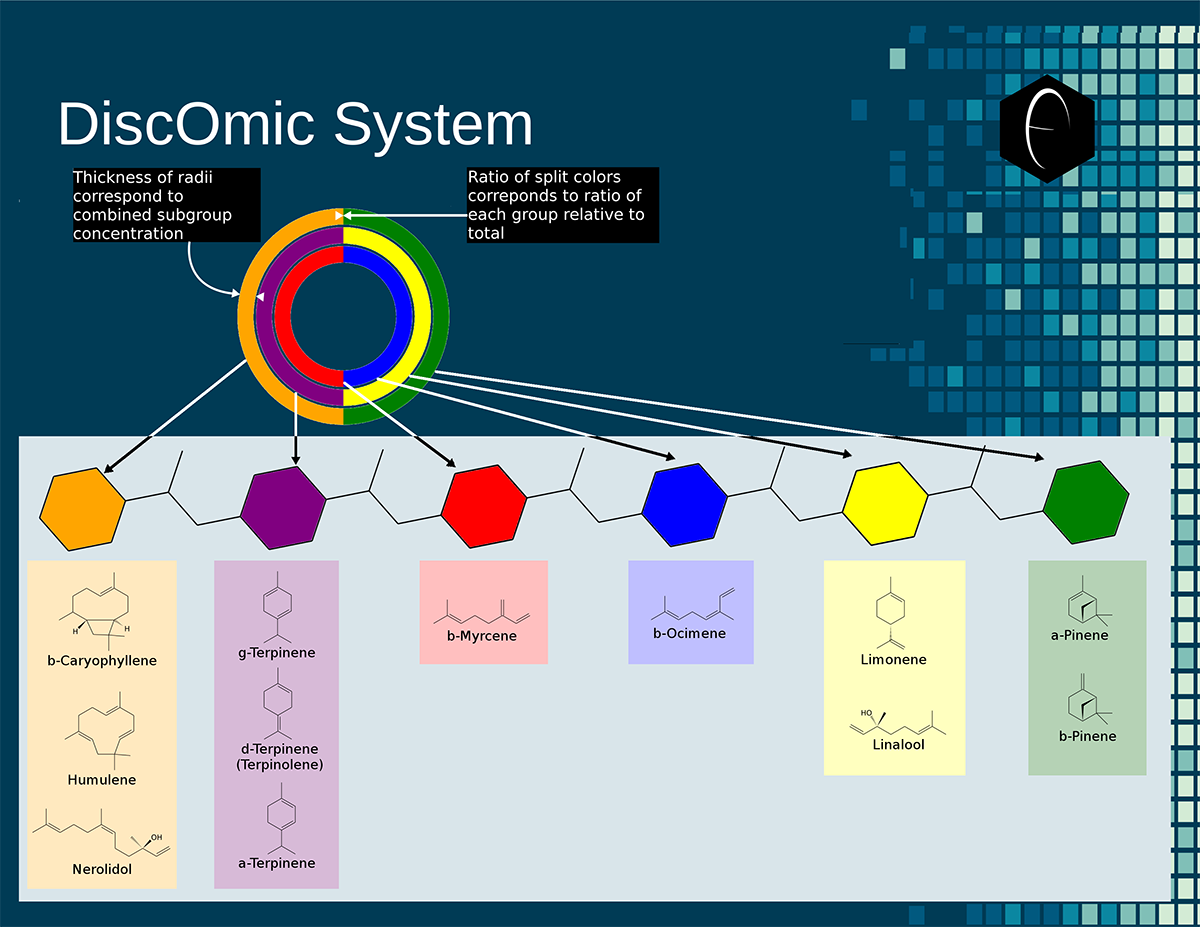 Diagram showing how the DiscOmic label can be display individual terpene content by using the color-coded terpene-group system outlined above.
In addition to being useful for similarity comparisons between strains of cannabis, the DiscOmic label can be read to describe the concentrations of individual terpenes or terpene groups in the cannabis sample. The nature of the groupings is determined via statistical analysis of cannabis with enzymology and biosynthesis pathways, which we will cover in greater detail later. The groupings follow this basic scheme:
- The inner layer is myrcene (red) vs. ocimene (blue)
- The middle layer is terpinenes and carene (purple) vs. limonene and linalool (yellow)
- The outer layer is caryophyllene, humulene, nerolidol (orange) vs. pinenes (green).
The greater the radius of the ring, the higher the concentration of the terpenes in that group. Using this system, a viewer of the DiscOmic label can tell what major terpenes are present in the cannabis. This is useful for two main predictions about the cannabis product: flavor and medicinal effect. To be able to use the colors of the DiscOmic label to predict the fragrance of a cannabis sample, the “smell and feel” of each color component needs to be understood by the viewer. To help the viewer better understand the scents of the component terpenes, we have included a chart illustrating these compounds’ scents.
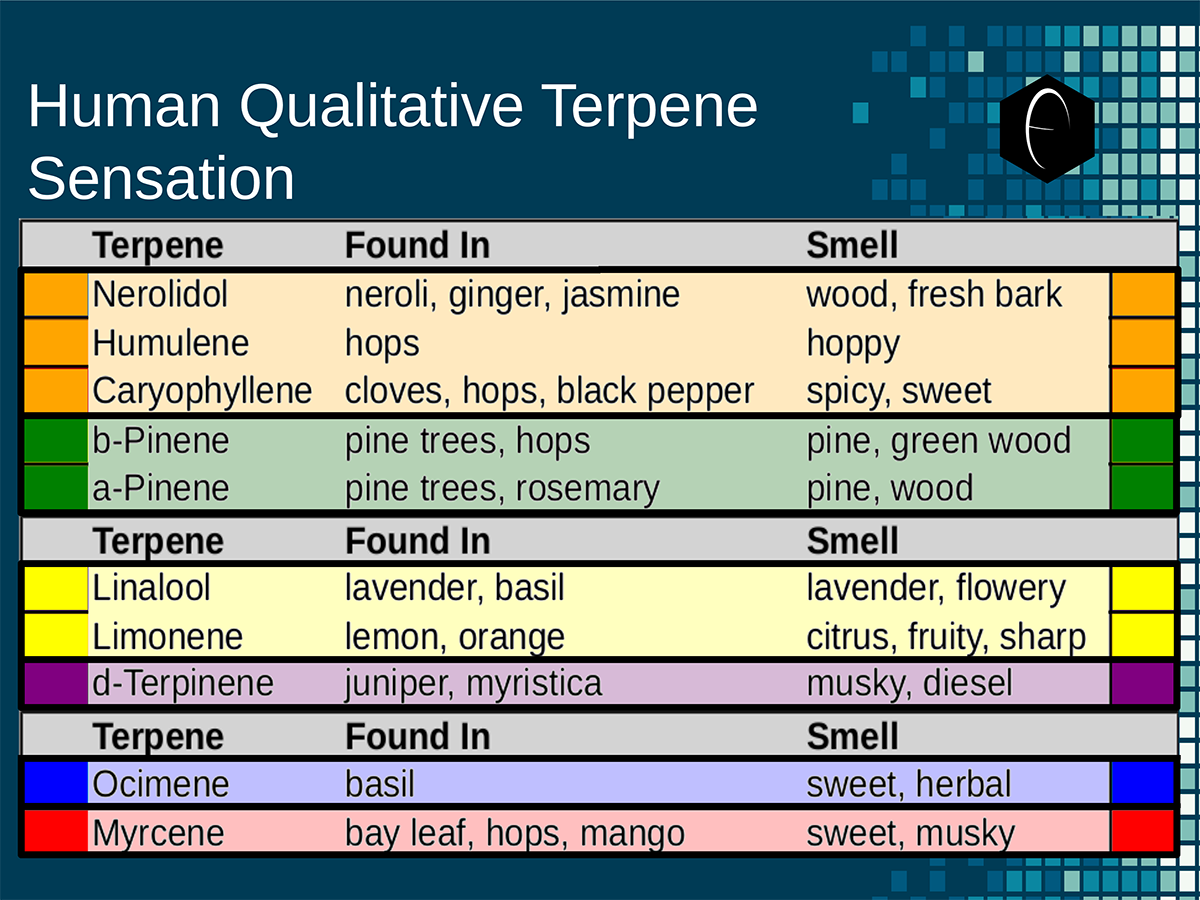 Chart outlining the human qualitative sensations of the major terpenes present in cannabis, color-coded with the DiscOmic label scheme. The chart outlines each terpene as it’s found in nature, and a description of the smell of the isolated terpene.
In addition to terpene profile informing on the flavor and fragrance of a cannabis sample, the medical value of cannabis is closely tied to its terpene content. At Digamma, we have built a database with 499 peer-reviewed medical science research papers looking at one or more of the components of cannabis in relation to human disease. Using this database, we have generated six tables showing the weighted contribution of each terpene to treating a set of disorders. This allows software to connect patients with specific disorders and make recommendations based on data derived from the DiscOmic label. The six tables we have summarized cover the following disorders: cancer, anxiety, depression, pain, insomnia, and infections.
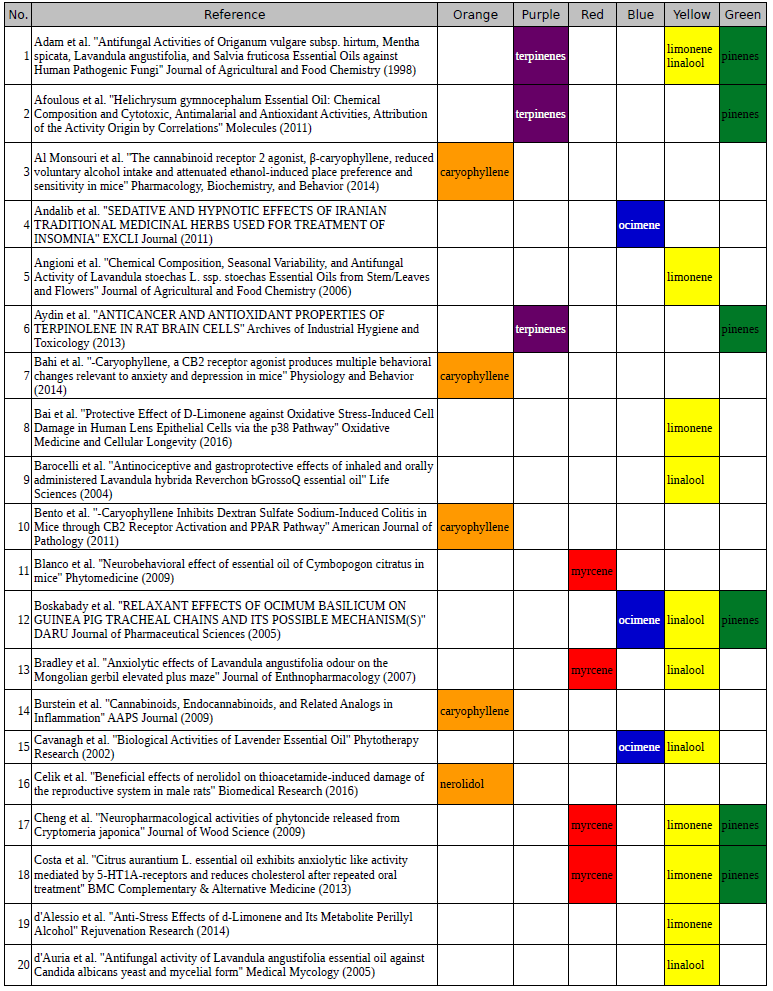
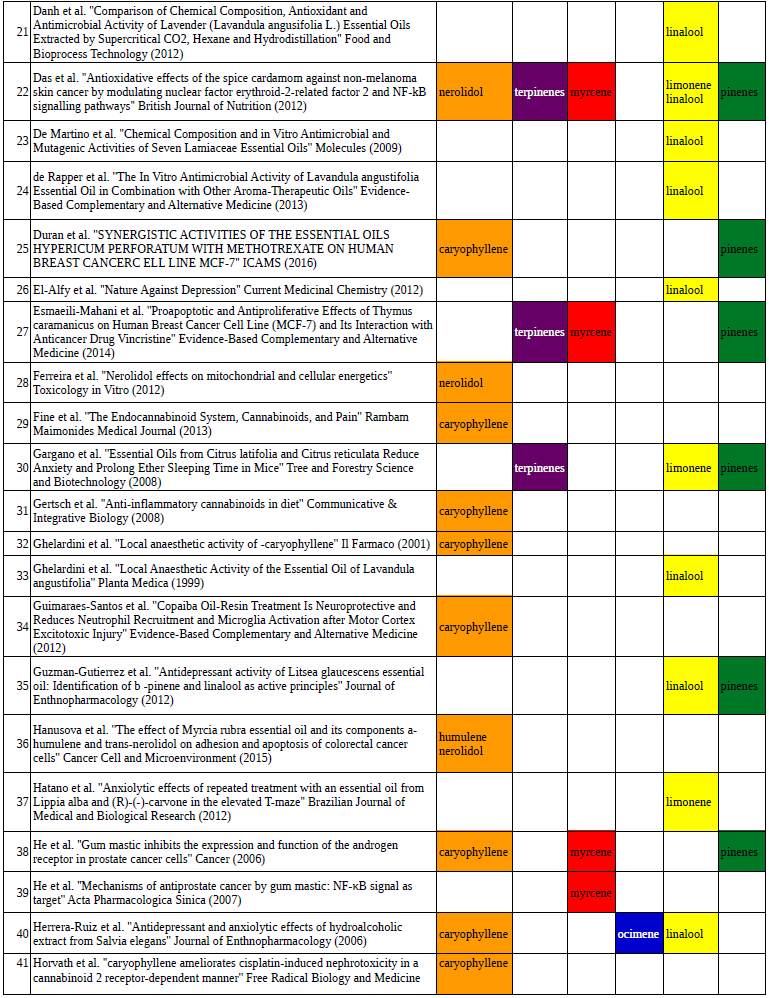
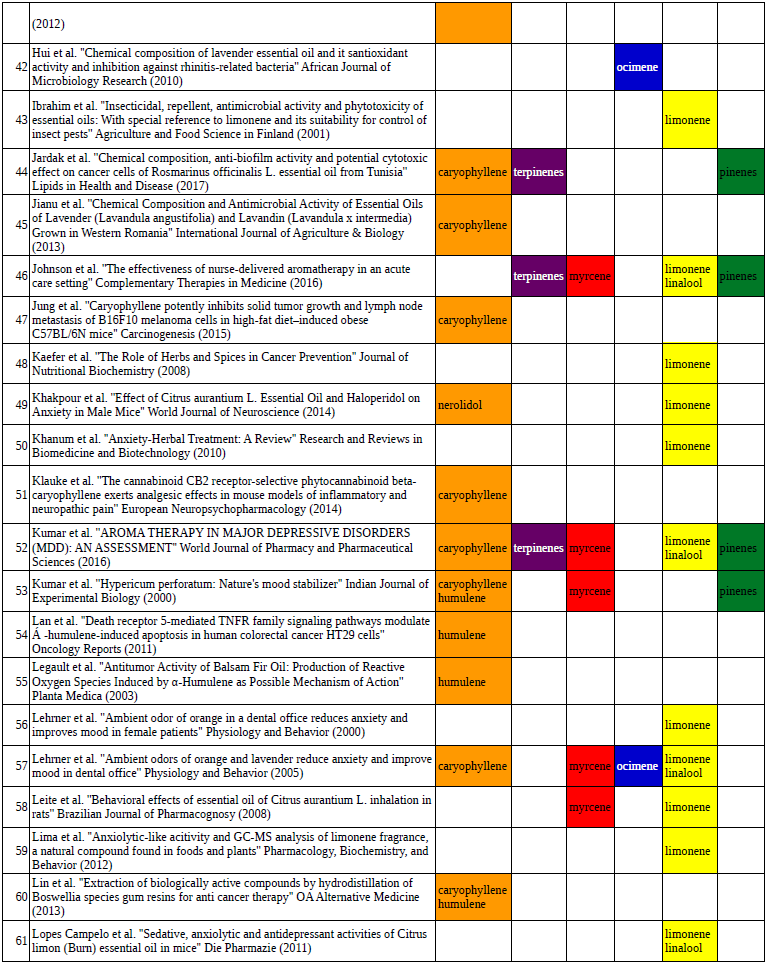
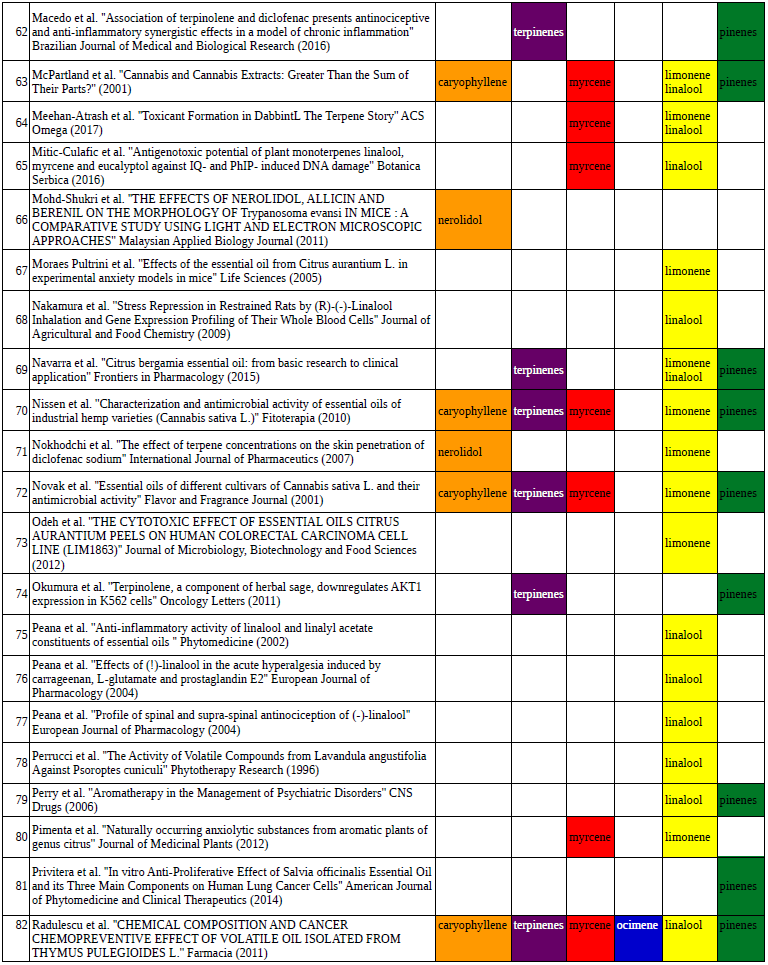
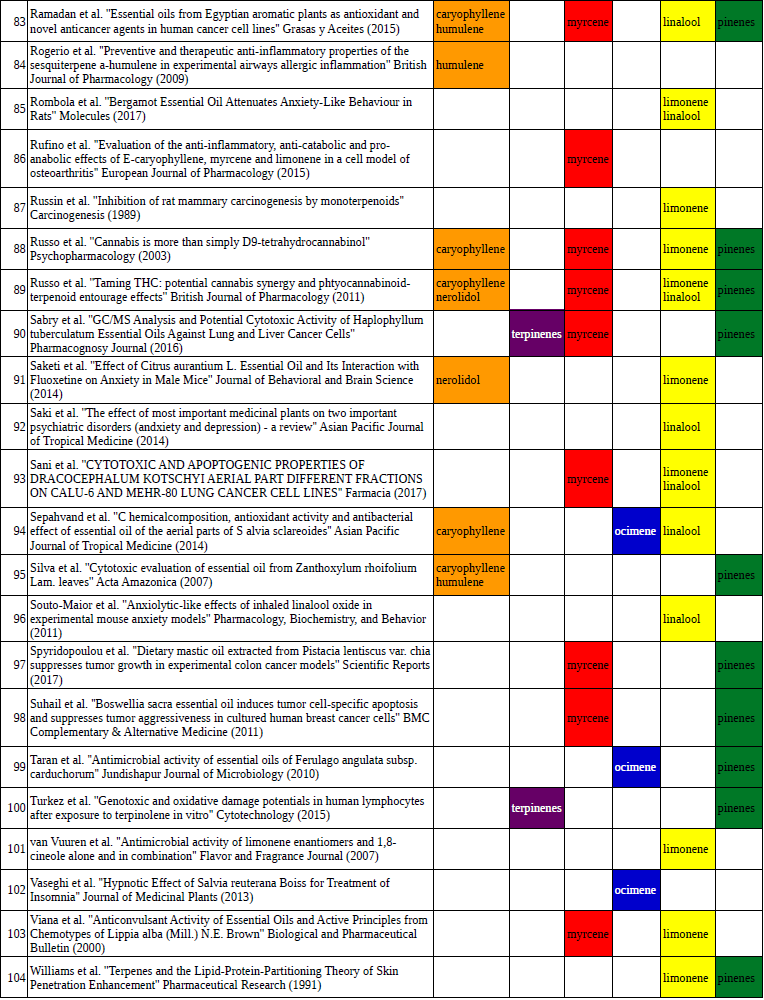
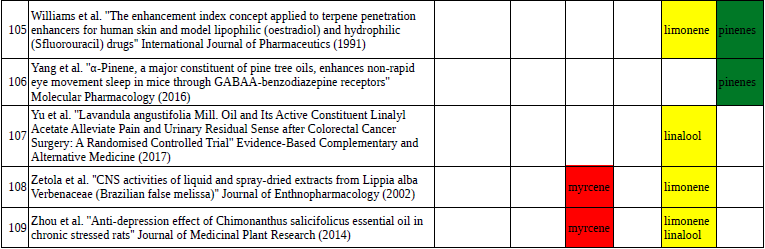
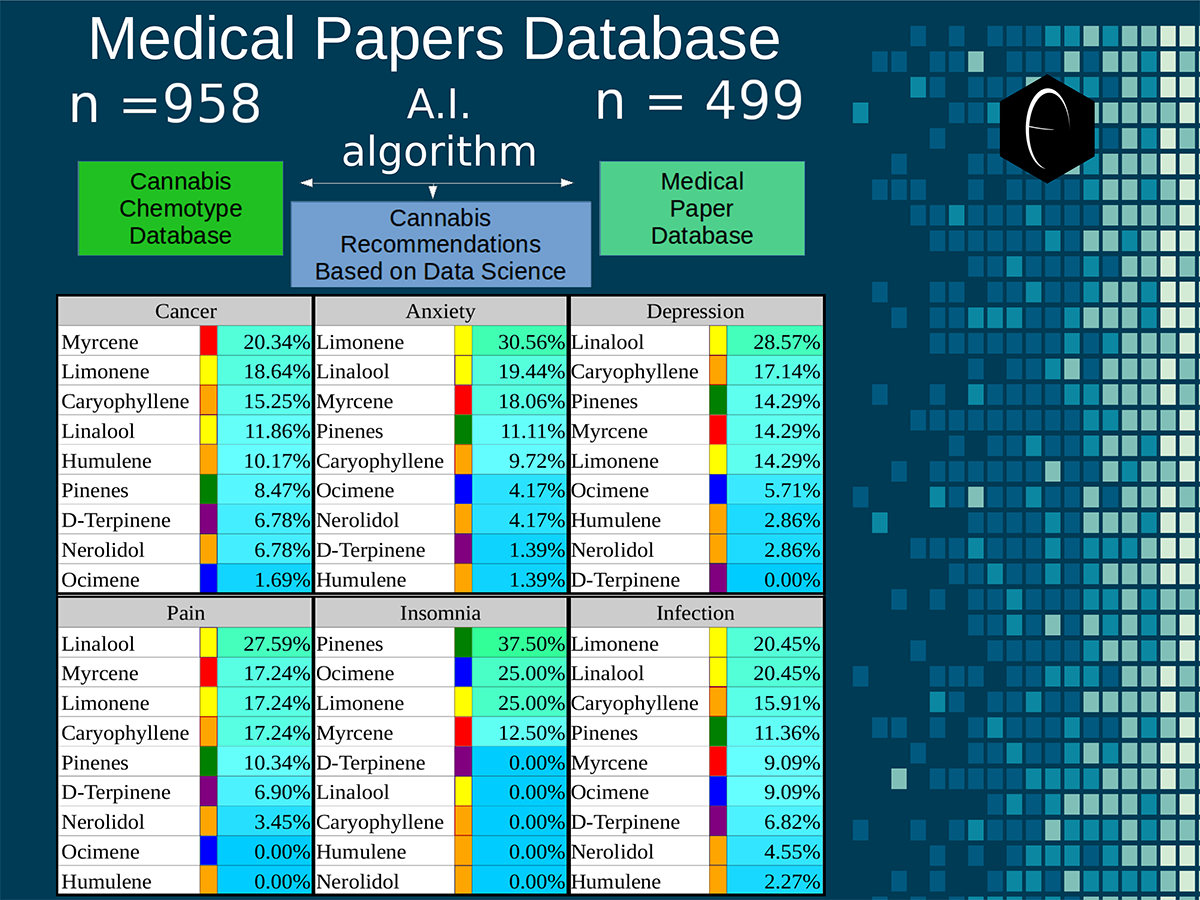 Six tables correlate the major terpenes in cannabis with the number of research studies confirming a connection between the listed terpene and the listed disorder. Terpenes have been color-coded to match their DiscOmic groupings. Lists were derived from dataset of 499 peer-reviewed publications and 958 unique cannabis flower samples analyzed for terpene content.
In the references we have provided a chart to help connect each terpene by DiscOmic group for those wishing to take a closer look at the scientific literature on the medical effects of terpenes.
| DiscOmic Group | Terpene | References |
| Orange | Caryophyllene | 6-34 |
| Orange | Humulene | 35-42 |
| Orange | Nerolidol | 43-50 |
| Purple | D-Terpinene (Terpinolene) | 51-59 |
| Red | Myrcene | 60-90 |
| Blue | Ocimene | 91-100 |
| Yellow | Limonene | 101-145 |
| Yellow | Linalool | 146-183 |
| Green | Pinenes | 184-200 |
How does the DiscOmic labeling system work?
There are two critical components to the DiscOmic system: statistical analysis using artificial intelligence (A.I.) algorithms and biochemical enzymology. The AI component explores and discovers relationships between terpene groups, and the enzymology component verifies and validates statistical patterns observed in the data gathered from the studies.
AI Component
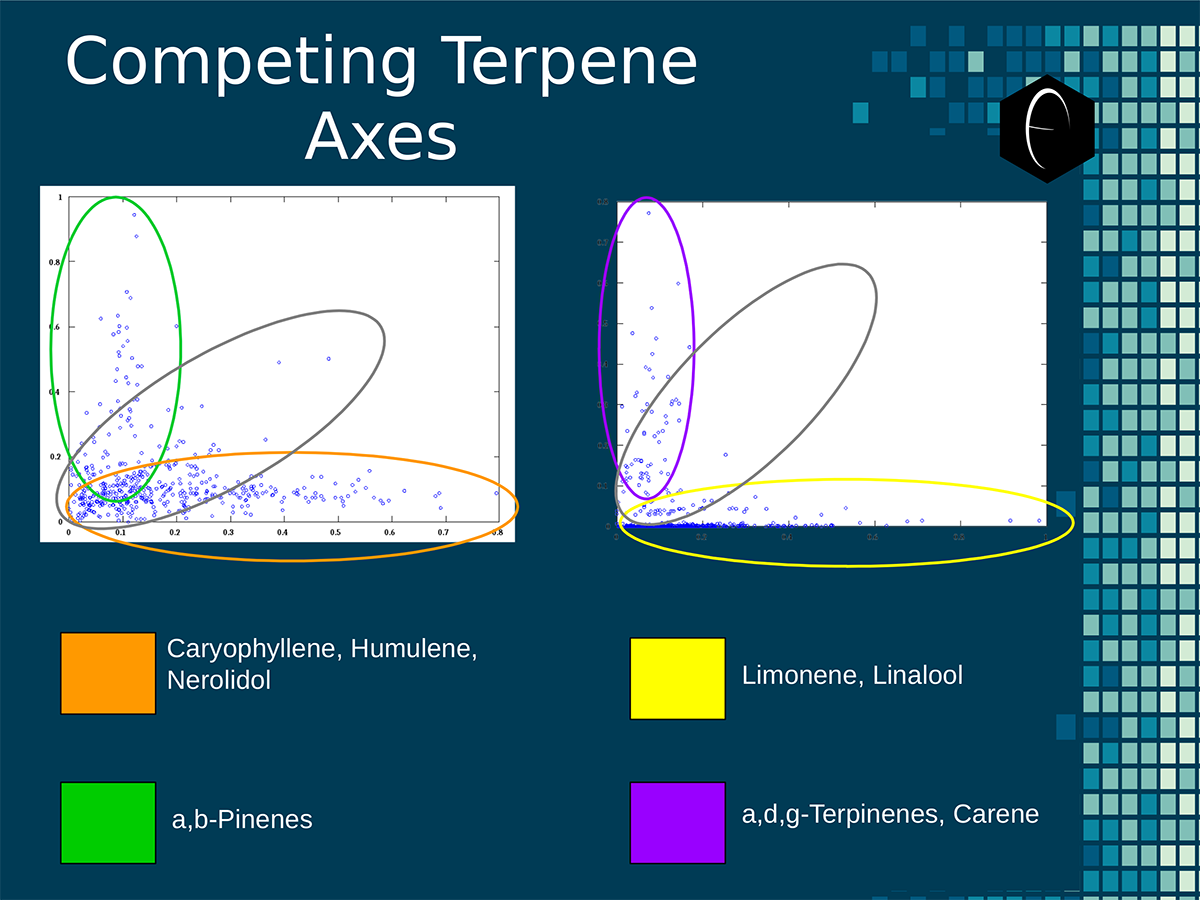 An illustration of the oppositional nature of competing terpene groups in two scatter diagrams. The left diagram compares the sum of the sesquiterpenes caryophyllene, humulene, and nerolidol to the sum of alpha and beta pinene. The right diagram compares the sum of limonene and linalool with the sum of the terpinenes and carene. All data has been normalized based on the dataset.
An AI approach that allows for the inclusion of both rapid multi-component comparison and the discovery and identification of stable groupings is a technique called self-organizing maps. In this data analytics technique, the data is plotted with every value treated as an independent axis. Because there can only be three spatial axes and this model uses 23, the data is grouped by similarity in a higher dimensional space. Once the data is scattered out in hyperspace, a process called unsupervised learning begins to collect patterns in the data. The algorithm is unaware of any group labels, and blindly looks for patterns in the hyperspace grouping. The result is that a dataset with 23 variables can be reduced into a dataset with six numbers, without losing significant information. In this way the process can be likened to a data compression program that creates a .zip archive file, because it reduces information in a way that does not lose anything that cannot be reconstructed from the compressed file itself. To better understand how human and robot minds created the six groups in the DiscOmic label system, we will examine some of the self-organizing maps that were created by unsupervised learning algorithms.
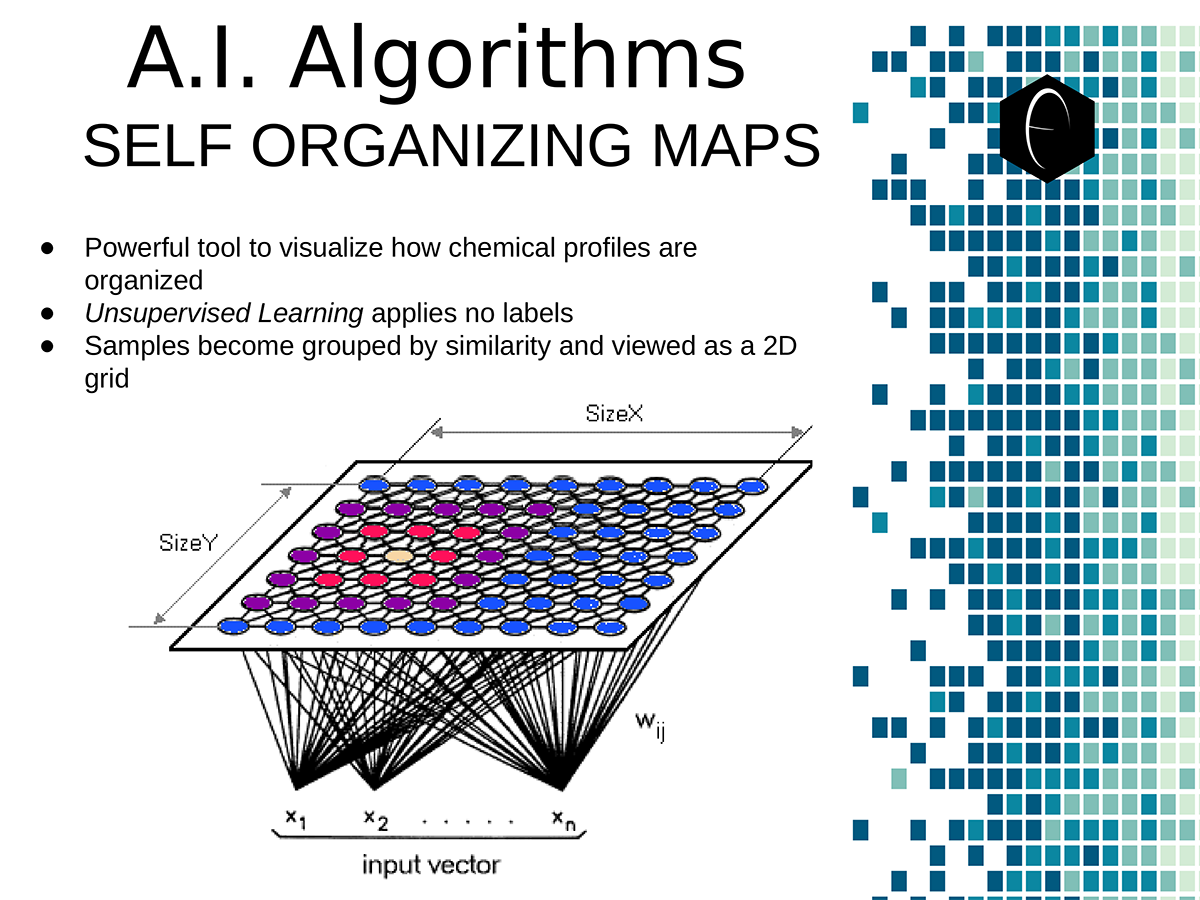 A diagram illustrating the concept of a self-organizing map. On the bottom the variables, x1, x2, etc, each have a connection to a sample represented on planar grid. The result is a heat map with a hot-spot over the cluster of samples representing the clustering of one of the variables.
The concept of a self-organizing map is essentially a plane in a higher dimensional space upon which each variable cluster can be projected. Because a plane is two-dimensional, we can visualize this space, and using colors in a heat map system, we can visualize the diffusion or spread of the clustering as its projection intersects with the plane. For self-organizing maps describing cannabis samples, each unit on the map represents a sample or group of samples. They are organized in the cluster sharing the feature or grouping of features, in this case high concentrations of certain terpenes. The self-organizing map is set to one terpene and the heat-map shows the cluster of that terpene in the grid. As the self-organizing maps of different terpenes are compared, the clustering within the group of samples can be seen readily, and the terpene groups can easily be identified.
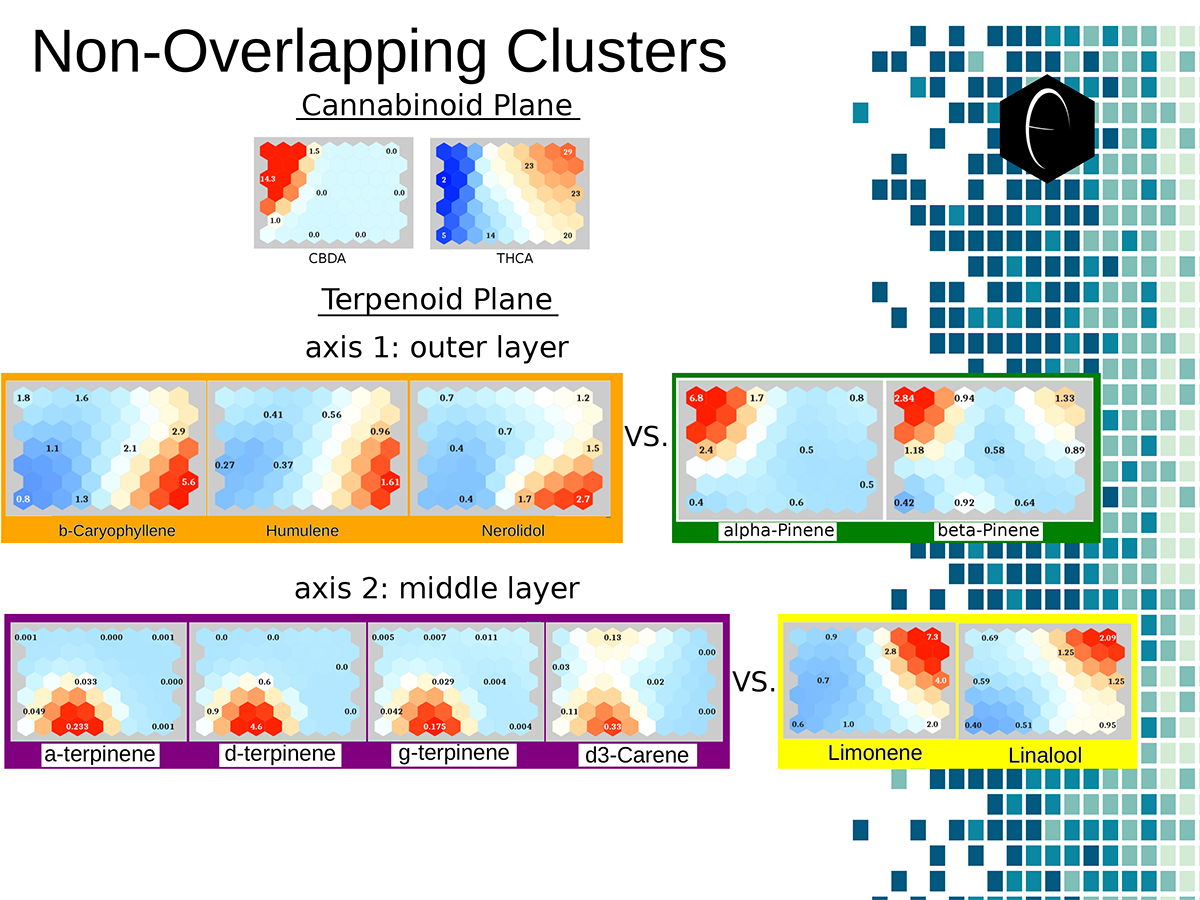 Illustration of two planes of cannabis data illustrated as self-organizing maps. The first plane shows only two components, CBDA and THCA. The second plane shows several terpene components which are grouped into opposing or non-overlapping clusters.
Examining the terpenoid plane across the major terpenes shows four major cluster spots, roughly corresponding to the four corners of the plane. The diametric opposition of the orange and green groups and the purple and yellow groups is graphically visible in the plane of the self organizing maps. With these 11 two-dimensional images, we have been able to correlate the kind of data that would have taken hundreds of two dimensional images generated with a more-traditional scatter-graph approach.
Enzymology Component
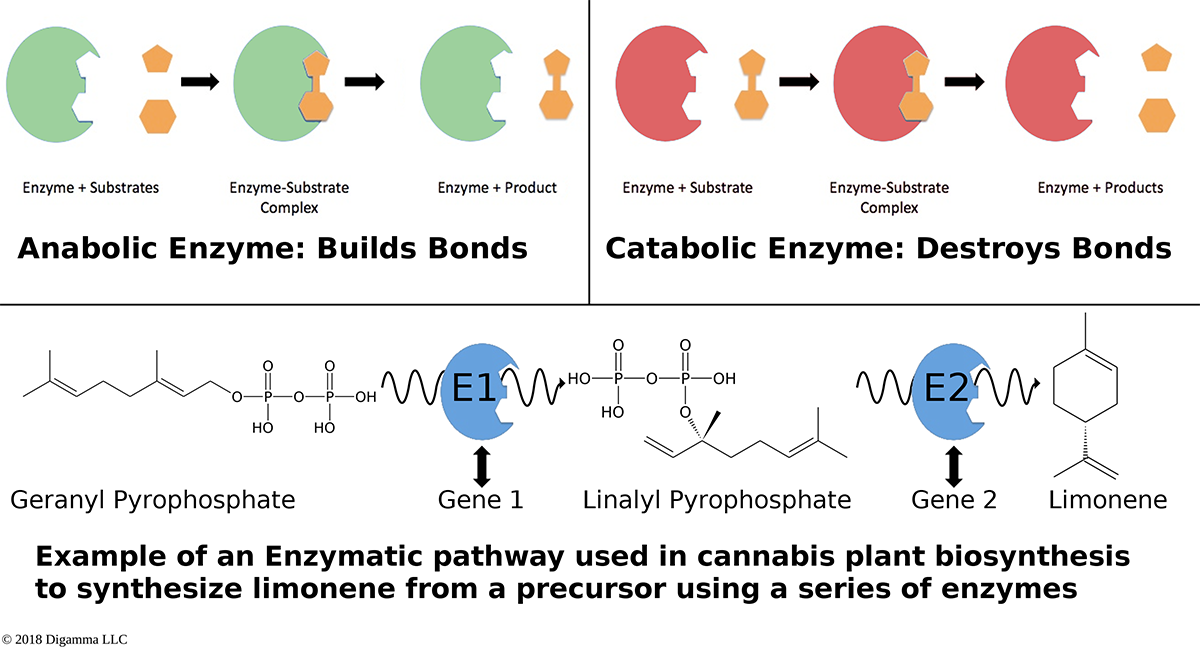 An overview of how enzymes mediate reactions that occur during biosynthesis. Clockwise from top-left: A scheme for an anabolic enzyme that builds chemical bonds; a scheme for a catabolic enzyme that destroys chemical bonds; and an example of a biosynthetic enzyme-mediated pathway of limonene.
Here we see a quick overview of the mechanism of enzymes. Enzymes are either anabolic, meaning that they build bigger molecules by forming chemical bonds, or catabolic, meaning they break molecules down by cleaving chemical bonds. In fact many enzymes have activity of both anabolism and catabolism, but every enzyme must be a member of at least one of the two categories. By using combinations of these enzymes that target different bonds and different molecules, nearly any molecule imaginable can be constructed. These linear biosynthetic pathways are the link between genetic information and physical traits. If a genome is a library, genes are like books, and each book is a set of instructions on how to build a specific enzyme or protein. Any physical difference in the enzyme will cause physical differences in molecules made by that enzyme. It is these differences in molecular structure that are the cause of the differences in physical traits in the whole organism. The anabolic process can be thought of as a long assembly line, where each enzyme modifies a chemical bond and then passes the molecule to the next enzyme in the line. This is graphically represented as biosynthetic pathways, like the one illustrated above for limonene. Although humans, for simplicity of interpretation, like to represent the pathway to one molecule as a straight line, the truth is that many molecules are made from common precursors, causing our linear biosynthetic pathways to branch out. Inside the cells of an organism, these pathways happen in parallel at the same time, and the precursor reaction must produce enough precursor to distribute to all the enzymes. If there is not enough precursor to keep every enzyme at full capacity, they compete for available precursors, often with the winners being faster reaction enzymes and the losers being slower reaction enzymes. To better illustrate the complexity of terpene biosynthesis and enzymology, we have constructed a biosynthetic mapping of terpenes and cannabinoids based on the research paper by Rodney Croteau published in 1987 on terpene synthesis.6 Although Croteau’s paper did not perform experiments in cannabis plants, the terpene synthesis pathways examined were similar enough to create a biosynthetic landscape within which the enzymological analysis of cannabis could operate.
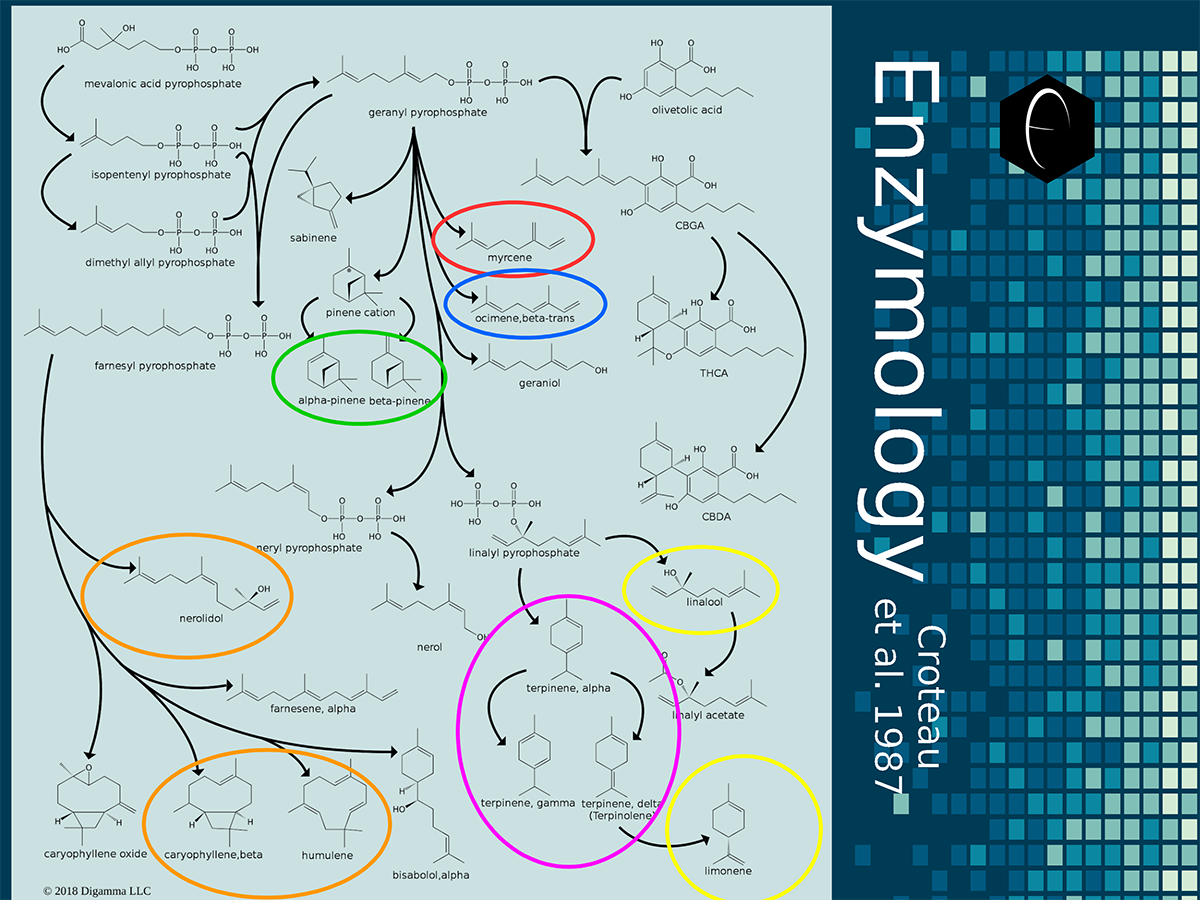 Map overview of the biosynthesis of terpenes in higher plants. The universal precursor, mevalonic acid pyrophosphate, can be seen in the top-left of the image. Arrows indicate enzymatic transformations and branch out in numerous directions to a variety of terpenes and intermediates. Colors from the DiscOmic system have been used to circle the major terpenes in each terpene group. Editor’s Note: Click the thumbnail for a larger image.
The complexity and coordination involved in biosynthesis is evident in the above enzymological map. The highlighting of the major terpenes in each of DiscOmic’s terpene group illustrates the complexity of finding these patterns, and why the AI measures described above were necessary for establishing definite patterns. Because the enzymology of terpene synthesis is so complex, we will examine a biosynthetic map that focuses exclusively on the compounds of interest and their common precursors in order to better understand each DiscOmic terpene group.
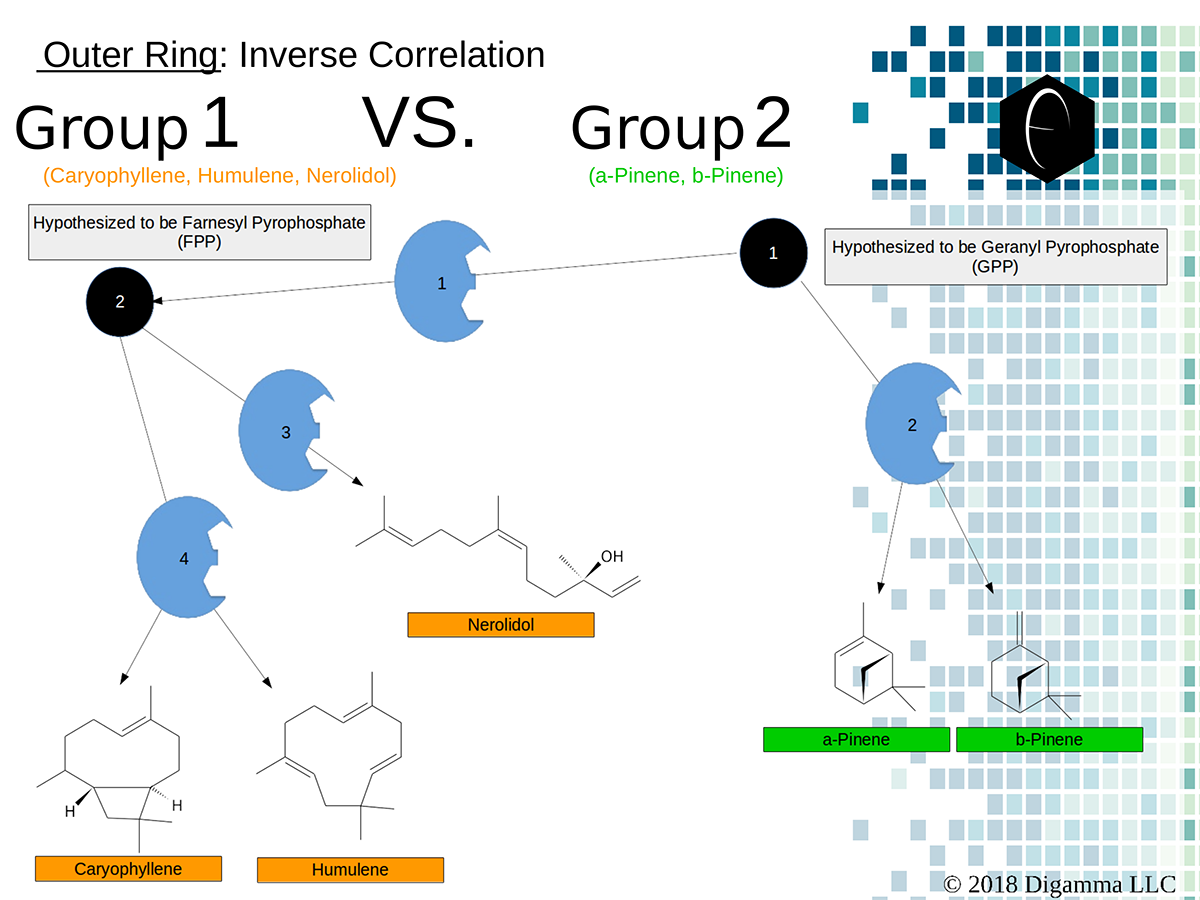 Enzymology mapping of the relationship between the outer-ring groups 1 and 2. Intermediates illustrated as black circles, and enzymes are indicated in blue. Terpenes are indicated by major group color.
The first map, the sesquiterpenes (orange) vs. the pinenes (green) is a straightforward inverse relationship. The best way to chemically explain inverse statistical relationships is to describe a system with a common precursor and two competing enzymes. In this scheme the common precursor is labeled as precursor 1 (or P1). P1 is hypothesized to be geranyl pyrophosphate based on the available data.6 Two enzymes, E1 and E2, compete for this precursor to generate intermediates that can either become pinenes or sesquiterpenes. Additional enzymes may mediate the distribution of terpenes within that group, such as E3 and E4 mediating P2, believed to be farnesyl pyrophosphate based on available evidence.6 Enzymological models such as this can easily explain the phenomenon where individual terpenes fail to have any correlation but show a strong correlation as a group. This would explain how the total of the group would be a more consistent number than the components, because the components of that group are all derived from a common precursor.
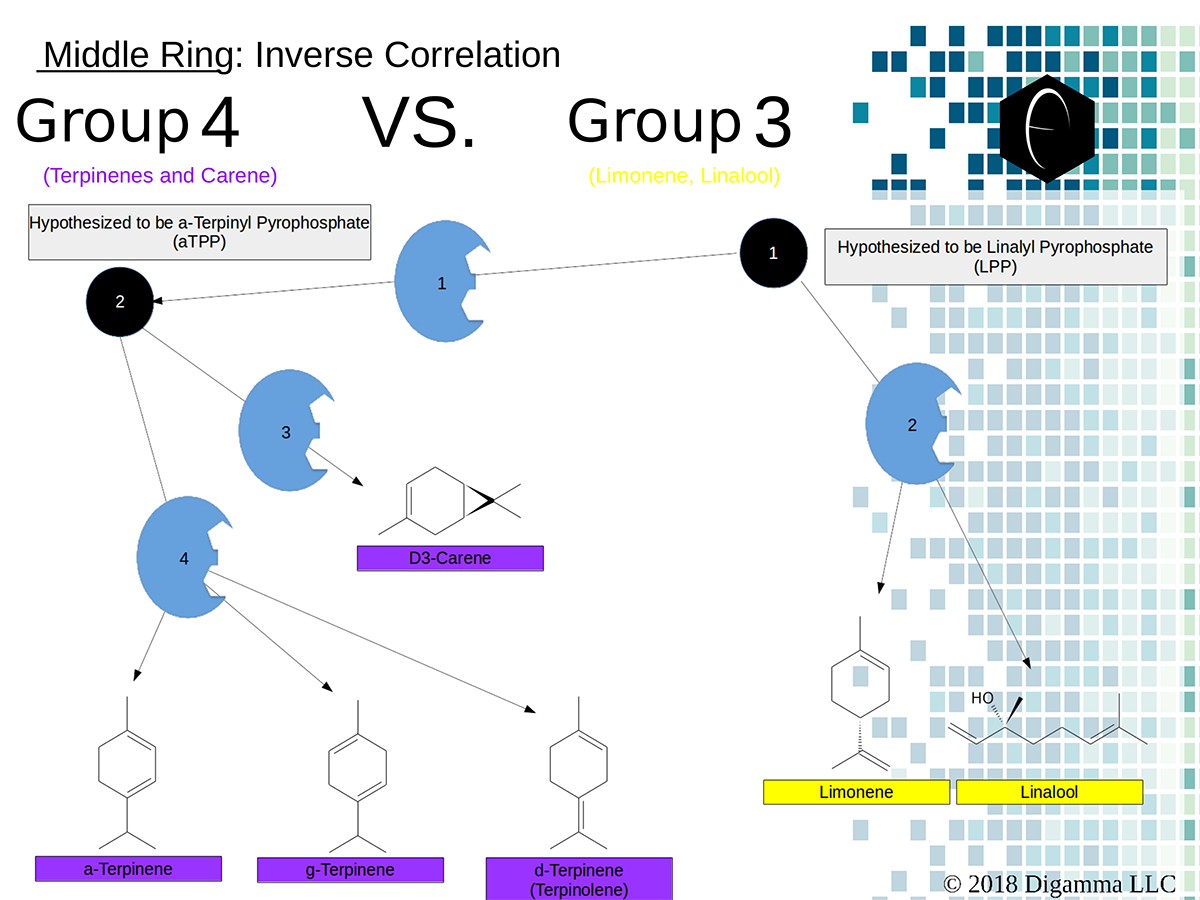 Enzymology mapping of the relationship between the middle-ring groups 4 and 3. Intermediates illustrated as black circles, and enzymes are indicated in blue. Terpenes are indicated by major group color.
The second map, the terpinenes (purple) vs. the limonene-linalool (yellow) is also a straightforward inverse relationship. Again, we hope to describe a system with a common precursor and two competing enzymes to explain the observed correlation. In this scheme the common precursor is labeled as precursor 1 (or P1). P1 is hypothesized to be linalyl pyrophosphate based on the available data.6 Two enzymes, E1 and E2, compete for this precursor to generate intermediates that can either become terpinenes or limonene-linalool. Additional enzymes may mediate the distribution of terpenes within that group, such as E3 and E4 mediating P2, believed to be alpha-terpinyl pyrophosphate.6 Once again, we see a scheme where individual terpenes fail to have much correlation but show tight correlation as a group. The reasoning is based on the stable number of the total, contrasted with the more chaotic competing enzymes that do the “final touches” on terpene synthesis.
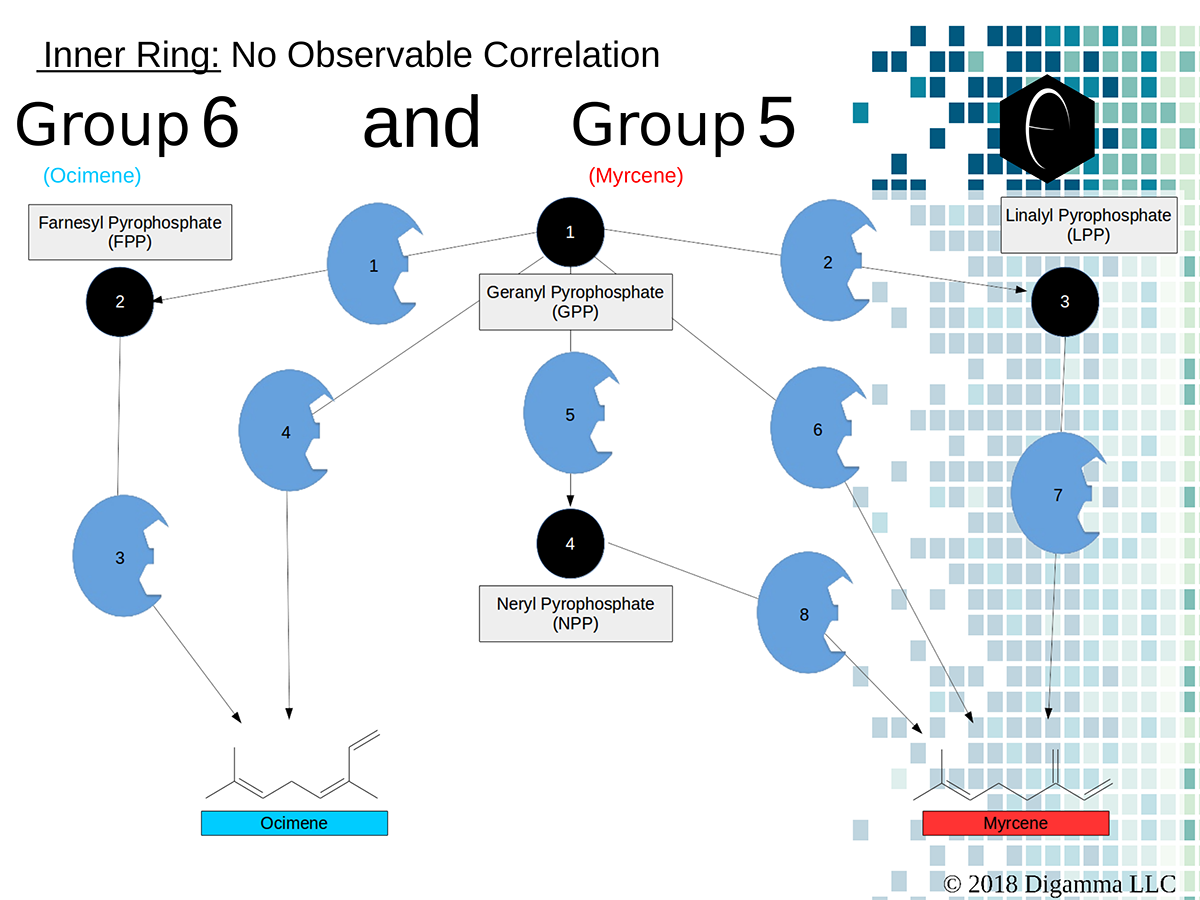 Enzymology mapping of the relationship between the inner-ring groups 6 and 5. Intermediates illustrated as black circles, and enzymes are indicated in blue. Terpenes are indicated by major group color.
The third map, ocimene (blue) vs. the myrcene (red) is also more complex relationship than was observed in the first or second map. Ocimene and myrcene are not inversely correlated, where the presence of one competes with the other, nor are they directly correlated, where the amount of one is tied to the amount of the other in a fixed ratio. This relationship shows no observable correlation, yet both terpenes are present at such high concentrations that they constitute a substantial portion of a cannabis sample’s terpene content. The lack of correlation between the two cannot be explained very easily, because both are known to be made through the precursor geranyl pyrophosphate.6 The best theory that fits the evidence at this time is that both ocimene and myrcene can be made from a common precursor, but each terpene can also be made from derivatives of that precursor.6 Now if ocimene and myrcene are made from the exact same precursors, then we would see them in a fixed ratio. But, if ocimene and myrcene are able to interact with different derivatives of geranyl pyrophosphate, then it would allow two independent numbers to be derived from the same baseline value of precursor. What would influence the final number of these two terpenes would be a mixture of enzymes, some affecting the myrcene pathway, some the ocimene pathway, and many having distinct effects on both. This degree of complexity is very common in enzymological schemes, especially in higher plants such as cannabis. With complications such as enzyme promiscuity, a phenomenon where one enzyme can actually cross-catalyze different reactions at different rates, these patterns can become even more challenging to understand. It is for this reason that tools for the consuming public, the cannabis industry, and the cannabis research community, are needed to help humans begin to benefit from the complexities of cannabis, even as the final aspects of our scientific understanding of the cannabis and human organisms are still being discovered.
References
- Russo, Ethan B. “Taming THC: potential cannabis synergy and phytocannabinoid‐terpenoid entourage effects.” British journal of pharmacology 163.7 (2011): 1344-1364.
- Russo, Ethan B., and John M. McPartland. “Cannabis is more than simply Δ 9-tetrahydrocannabinol.” Psychopharmacology 165.4 (2003): 431-432.
- What is Cannabidiol? | Project CBD – https://www.projectcbd.org/science/terpenes/terpenes-and-entourage-effect
- CNN | Dr. Sanjay Gupta – https://edition.cnn.com/2014/03/11/health/gupta-marijuana-entourage/
- McPartland, John M., and Ethan B. Russo. “Cannabis and cannabis extracts: greater than the sum of their parts?.” Journal of Cannabis Therapeutics 1.3-4 (2001): 103-132.
- Croteau, Rodney. “Biosynthesis and catabolism of monoterpenoids.” Chemical Reviews 87.5 (1987): 929-954.
Additional References
 Do you want to receive the next Grower’s Spotlight as soon as it’s available? Sign up below!
Resources:
Want to get in touch with Marco? He can be reached via the following methods:
- Website: https://www.digammaconsulting.com/
- Email: marco@digammaconsulting.com