In this article, Marco Troiani and Savino Sguera of Digamma Consulting explain a new labeling system for cannabis consumers and its utility.
The following is an article produced by a contributing author. Growers Network does not endorse nor evaluate the claims of our contributors, nor do they influence our editorial process. We thank our contributors for their time and effort so we can continue our exclusive Growers Spotlight service.
Editor's Note: This is a long contributor article, so I have included links to skip to different sections.
Why is a labeling system needed for cannabis?
The purpose of a labeling system is to communicate the contents of a product to an interested observer. The observer could be a prospective consumer about to make a purchase or a producer or broker who is negotiating industrial scale purchases and sales of product.
In many industries, such as food, labeling conventions have been well-established. The FDA has developed very specific guidelines for foods, showing the now famous “Nutrition Facts” label that displays the three basic biomolecular categories: protein, carbohydrates, and fats. Looking at this label, a person can get a sense of what they are about to ingest. For example butter, olive oil, coconut oil, and avocado are all very high in fats. Wheat, potato, corn, rice, and sugarcane are all almost entirely carbohydrates. Meats and beans have very high protein contents. Most nuts are considered as “superfoods” because they contain an even balance of protein, carbs, and fats.
Another example exists in the pharmaceutical industry, which is also regulated by the FDA. The labels for drugs are very different from the food industry. Whereas food represents a living continuum of countless chemical diversity, drugs are designed to ideally have only one or two active ingredients per pill, with the rest made up of an inactive filler. Pharmaceuticals are rather easy to label because all one needs to do is label the dose of the active compound and the consumer knows all they need to know about a particular formulation of a medicine.
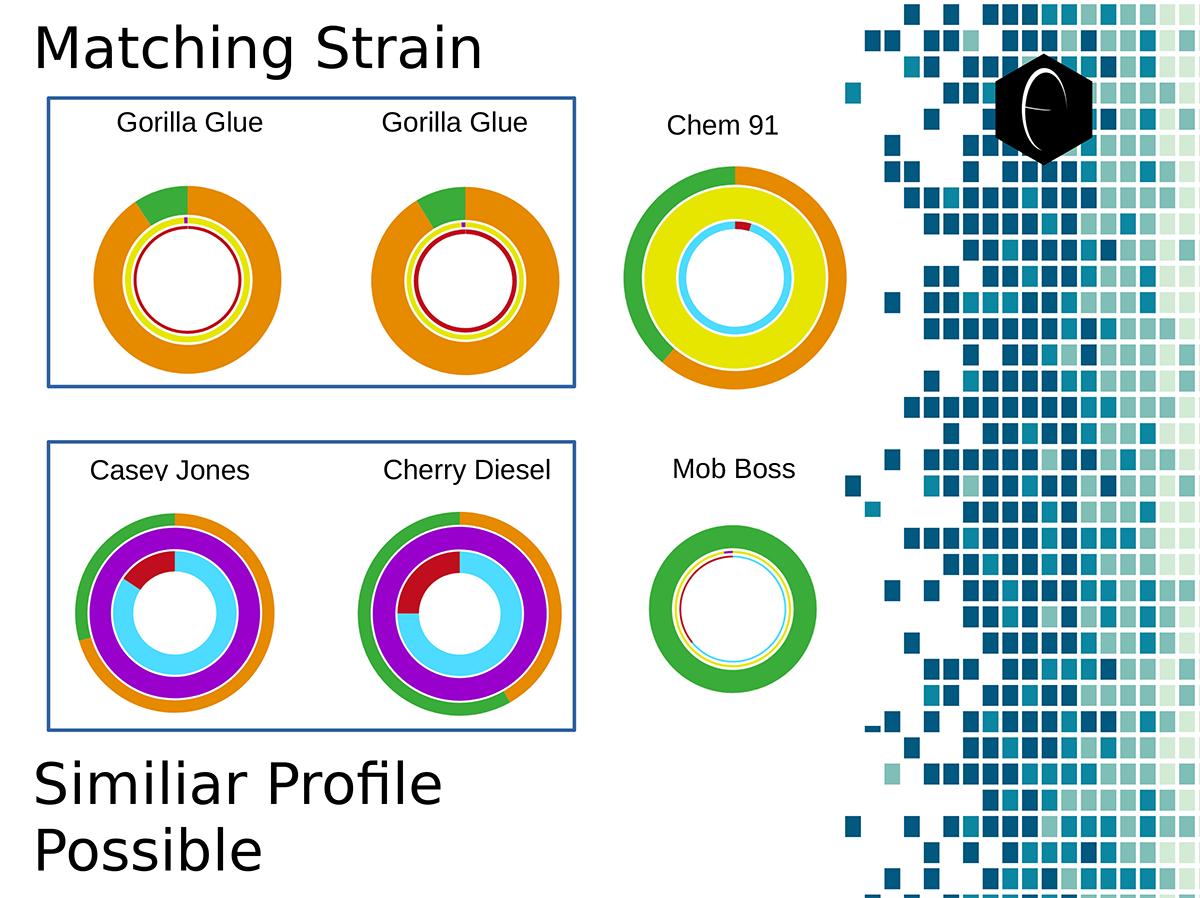 Image showing six different samples that were lab tested for terpenes, and their resulting DiscOmic labels. Note the intuitive nature of recognizing self-similarity makes this system very easy to use. Of the six profiles, two showed noteworthy similarity and have been outlined in blue.
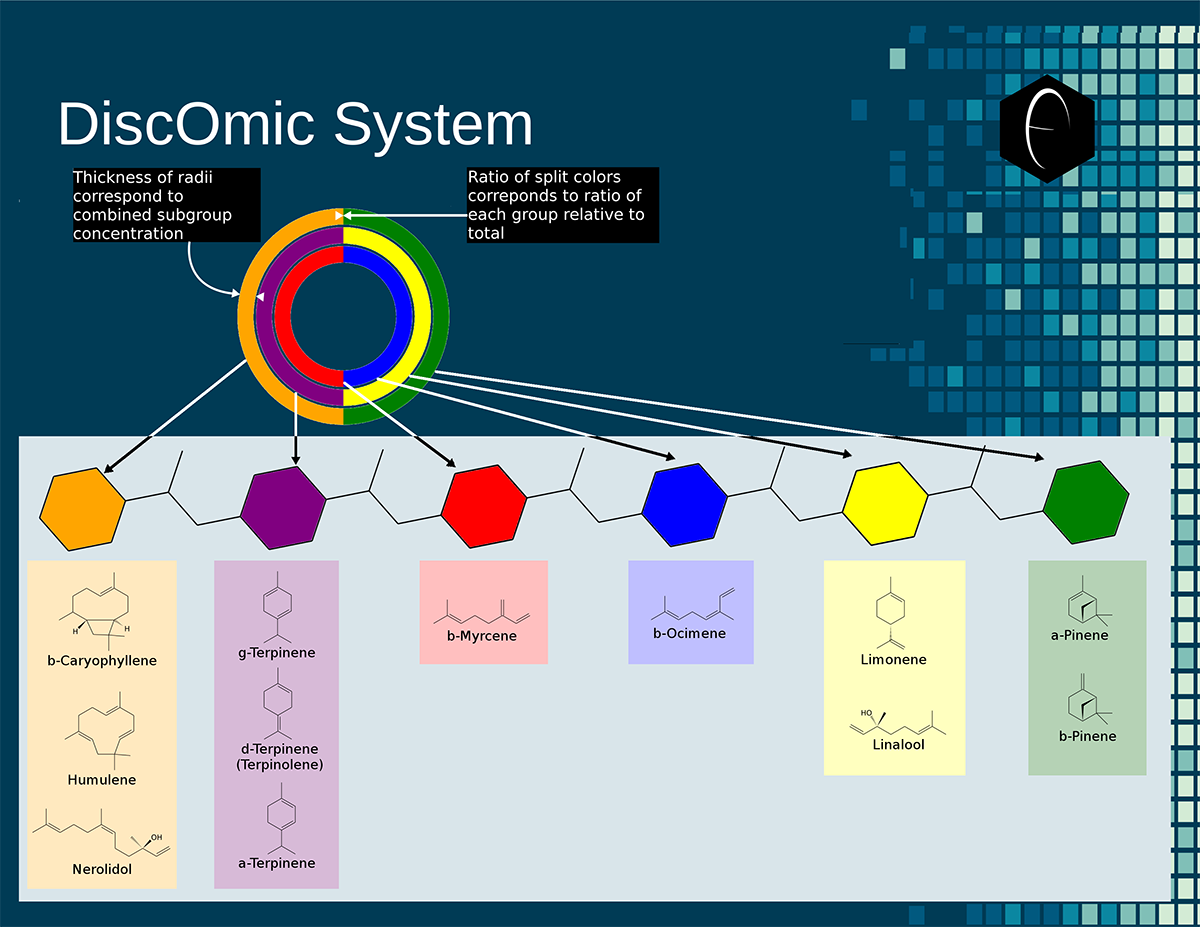 Diagram showing how the DiscOmic label can be display individual terpene content by using the color-coded terpene-group system outlined above.
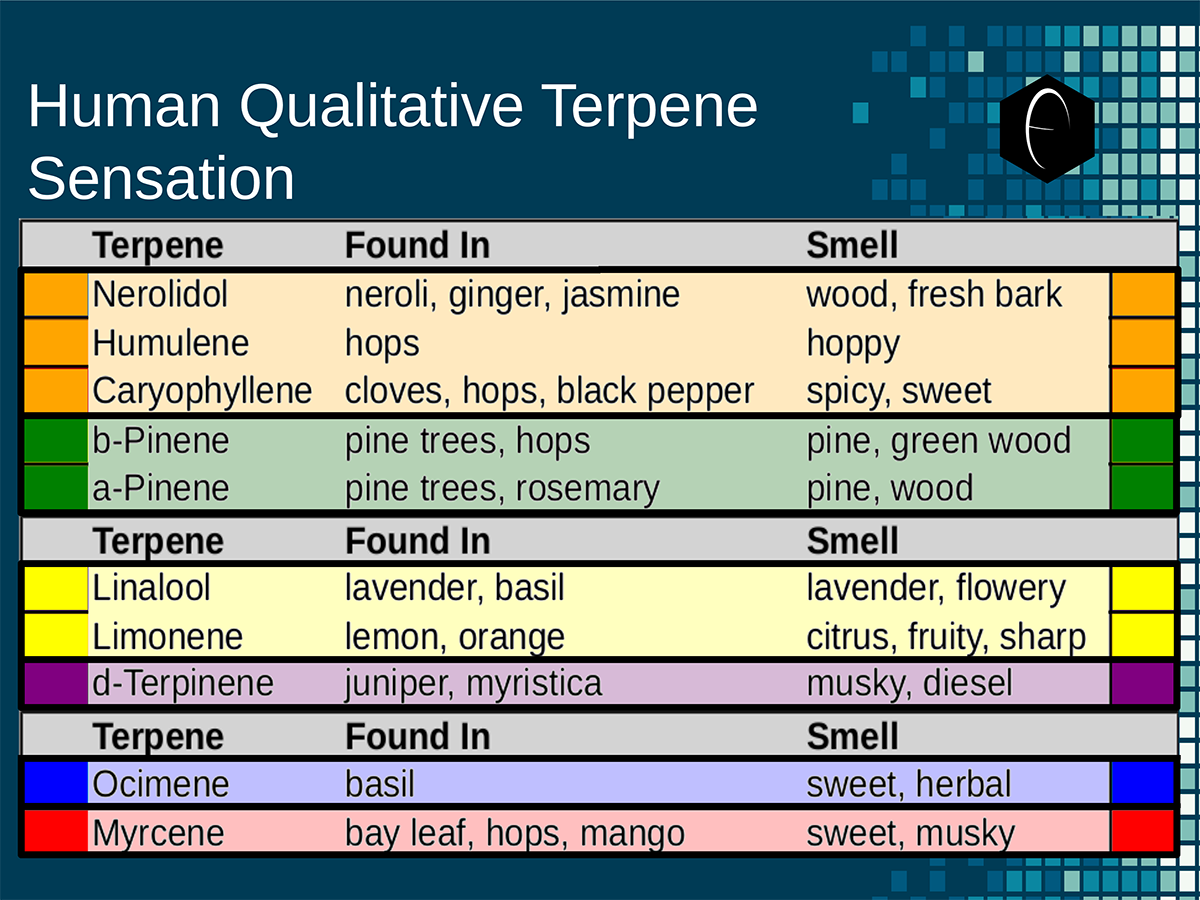 Chart outlining the human qualitative sensations of the major terpenes present in cannabis, color-coded with the DiscOmic label scheme. The chart outlines each terpene as it’s found in nature, and a description of the smell of the isolated terpene.
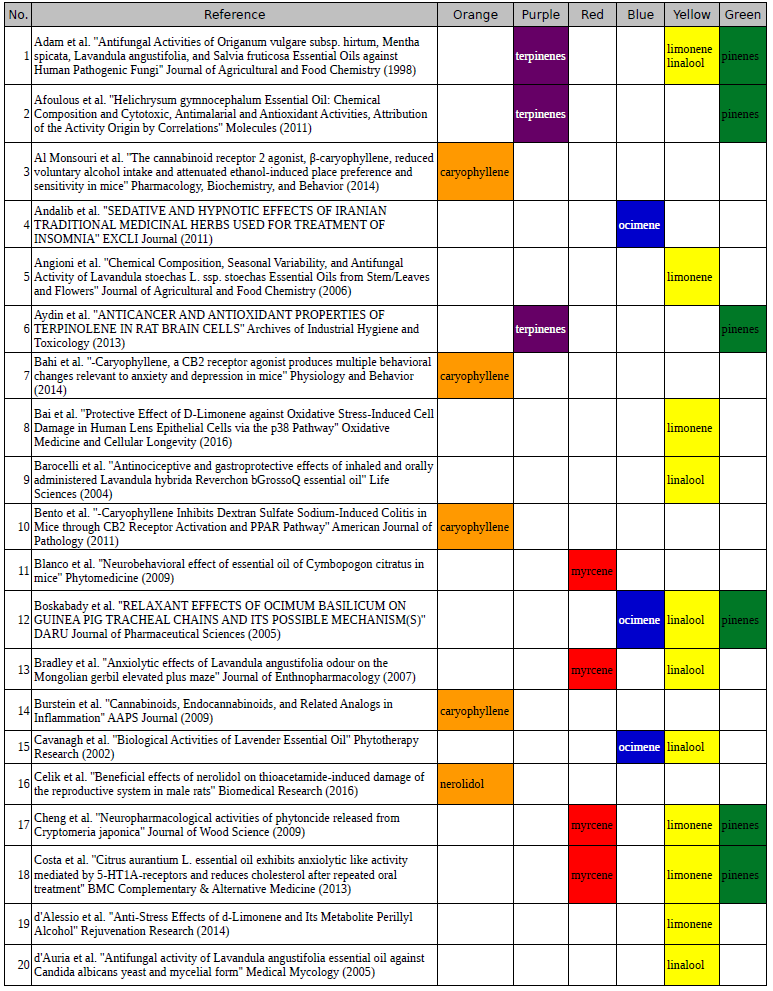
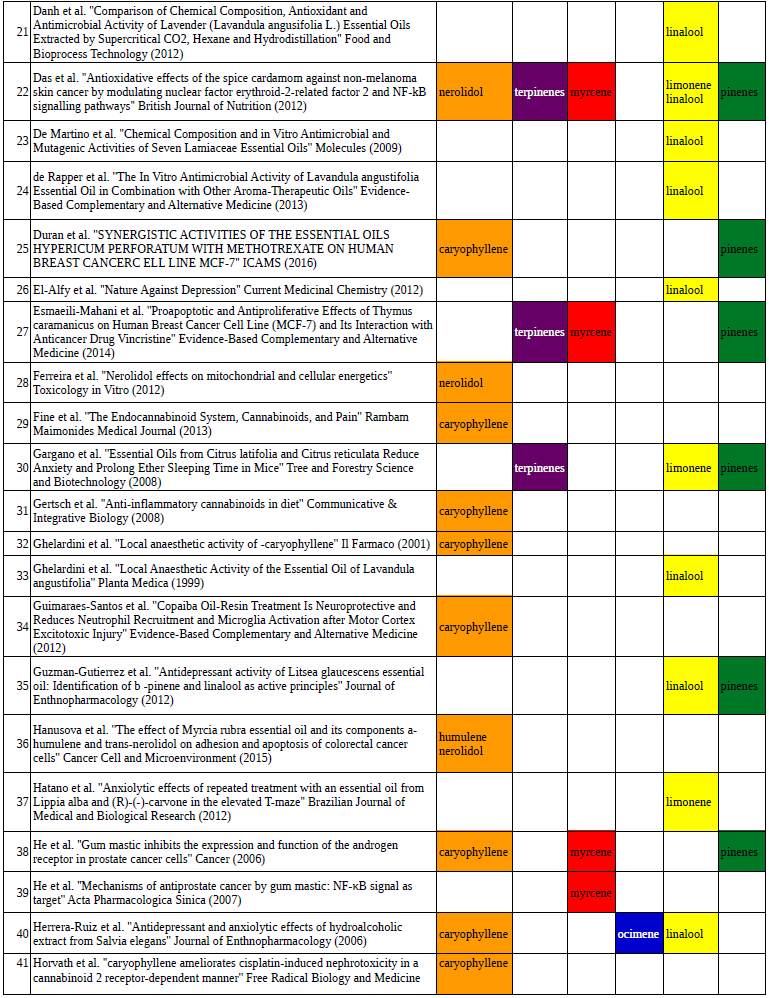
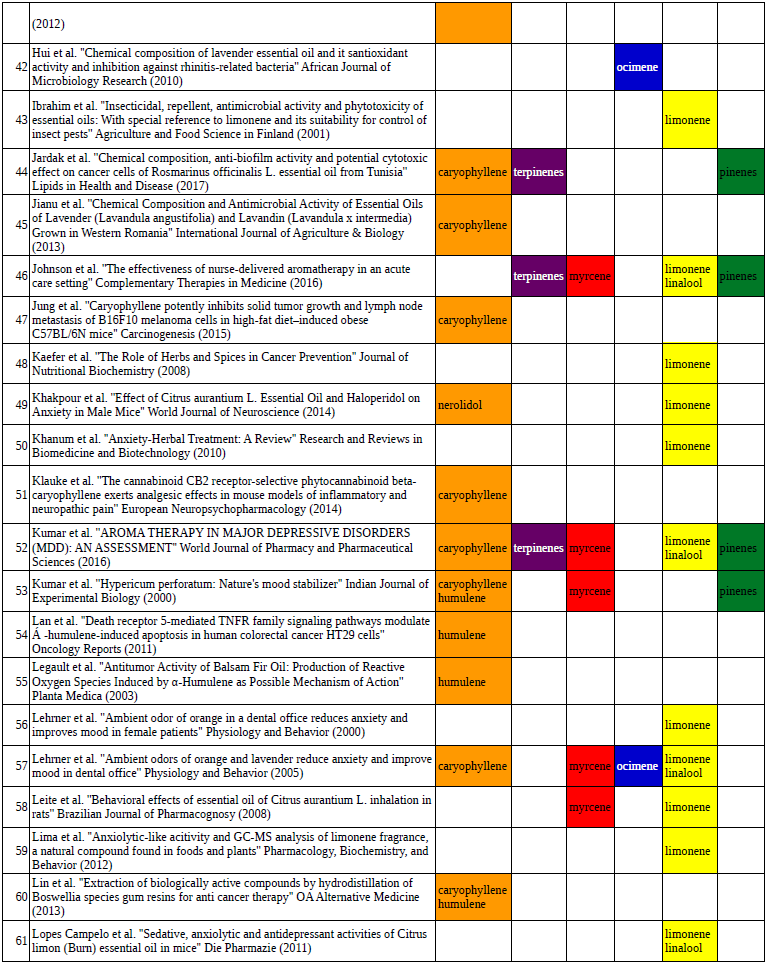
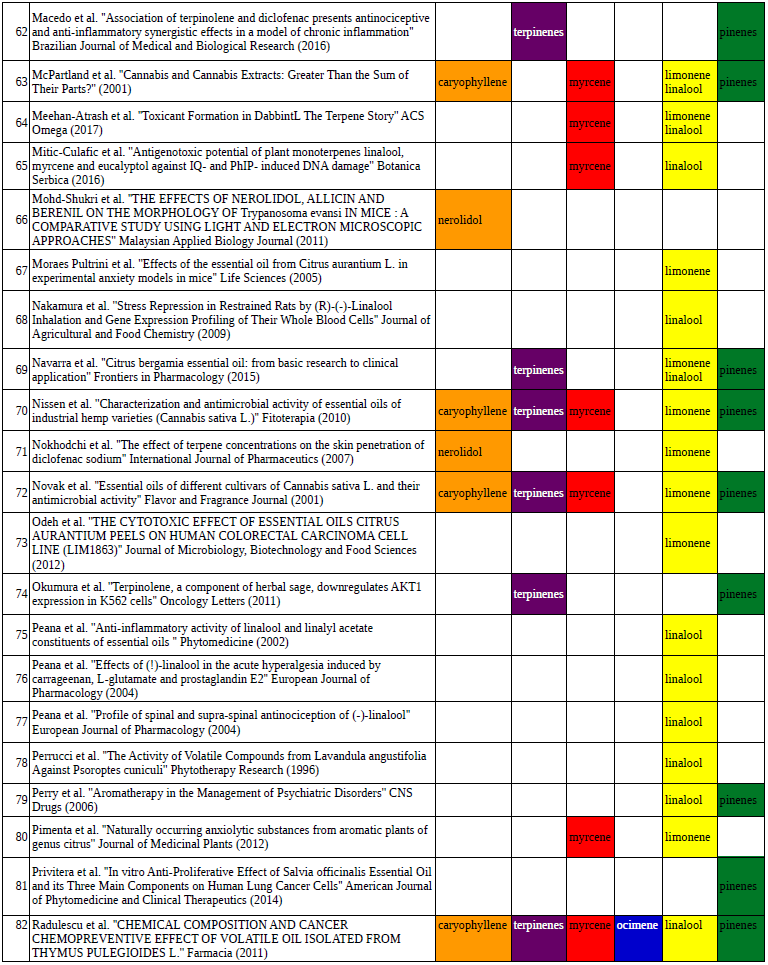
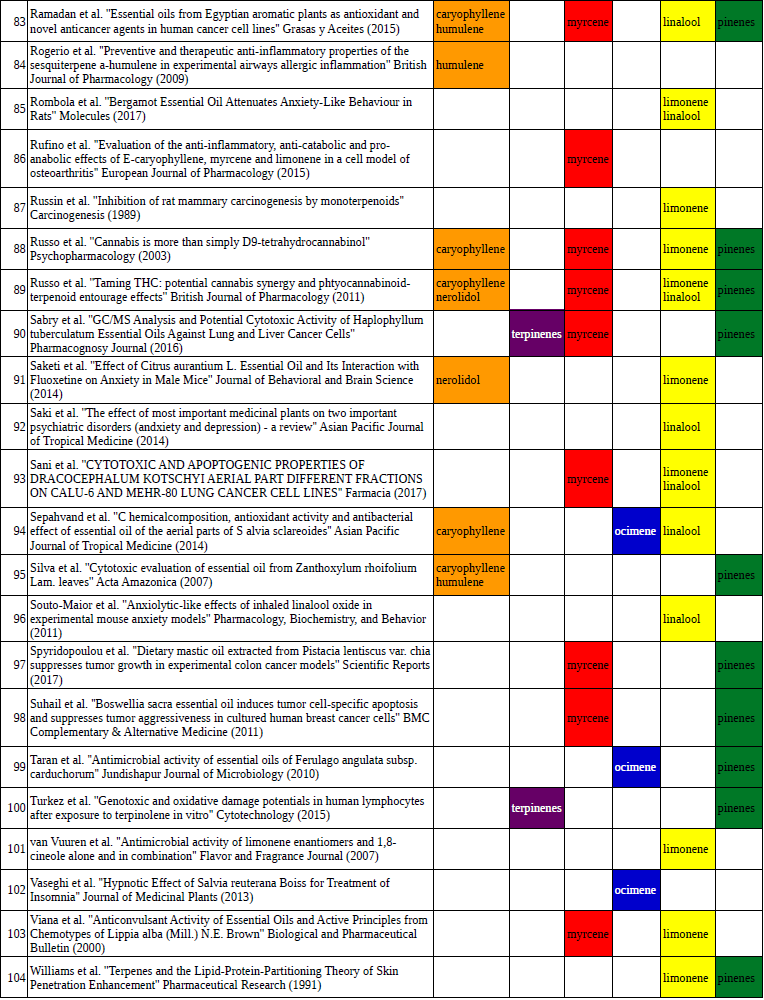
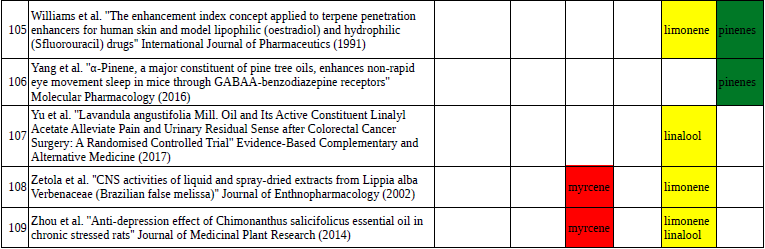
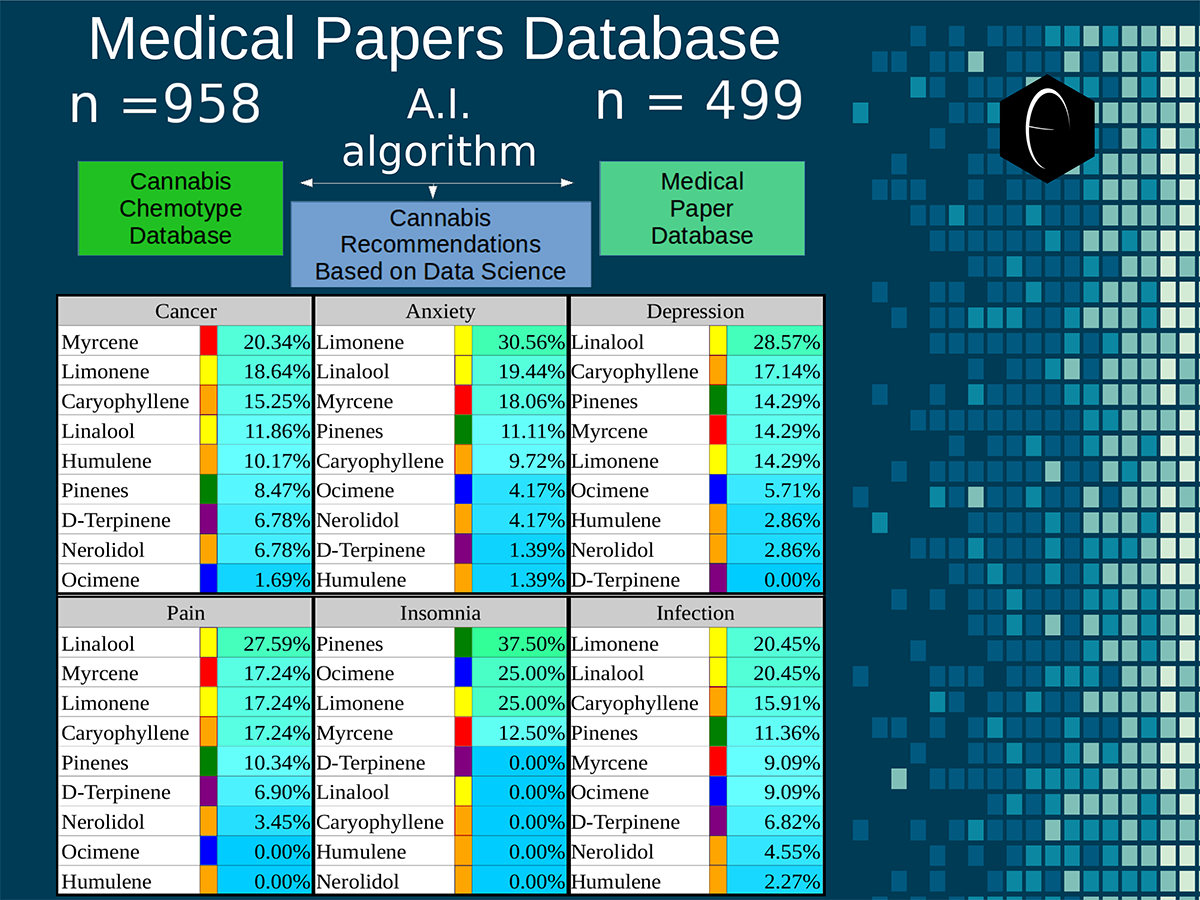 Six tables correlate the major terpenes in cannabis with the number of research studies confirming a connection between the listed terpene and the listed disorder. Terpenes have been color-coded to match their DiscOmic groupings. Lists were derived from dataset of 499 peer-reviewed publications and 958 unique cannabis flower samples analyzed for terpene content.
How does the DiscOmic labeling system work?
There are two critical components to the DiscOmic system: statistical analysis using artificial intelligence (A.I.) algorithms and biochemical enzymology. The AI component explores and discovers relationships between terpene groups, and the enzymology component verifies and validates statistical patterns observed in the data gathered from the studies.
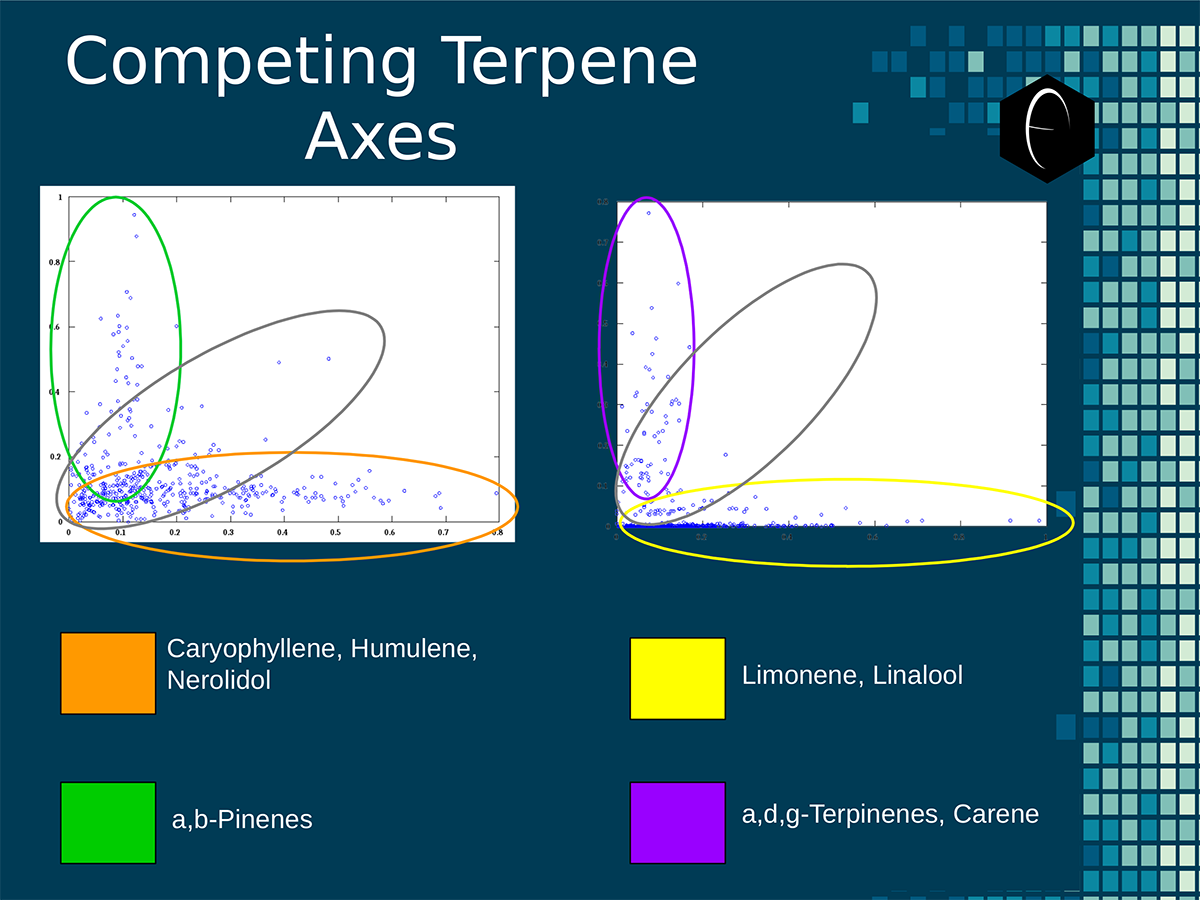 An illustration of the oppositional nature of competing terpene groups in two scatter diagrams. The left diagram compares the sum of the sesquiterpenes caryophyllene, humulene, and nerolidol to the sum of alpha and beta pinene. The right diagram compares the sum of limonene and linalool with the sum of the terpinenes and carene. All data has been normalized based on the dataset.
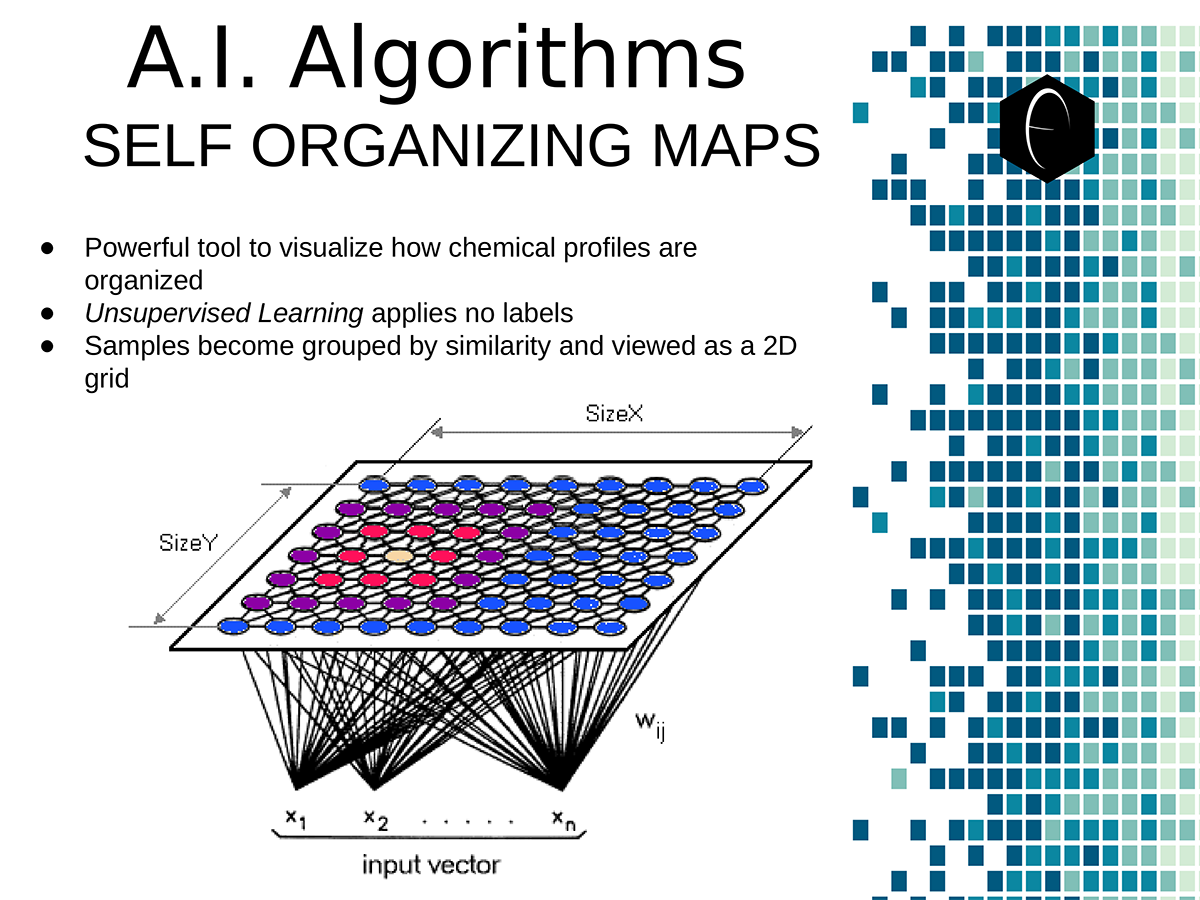 A diagram illustrating the concept of a self-organizing map. On the bottom the variables, x1, x2, etc, each have a connection to a sample represented on planar grid. The result is a heat map with a hot-spot over the cluster of samples representing the clustering of one of the variables.
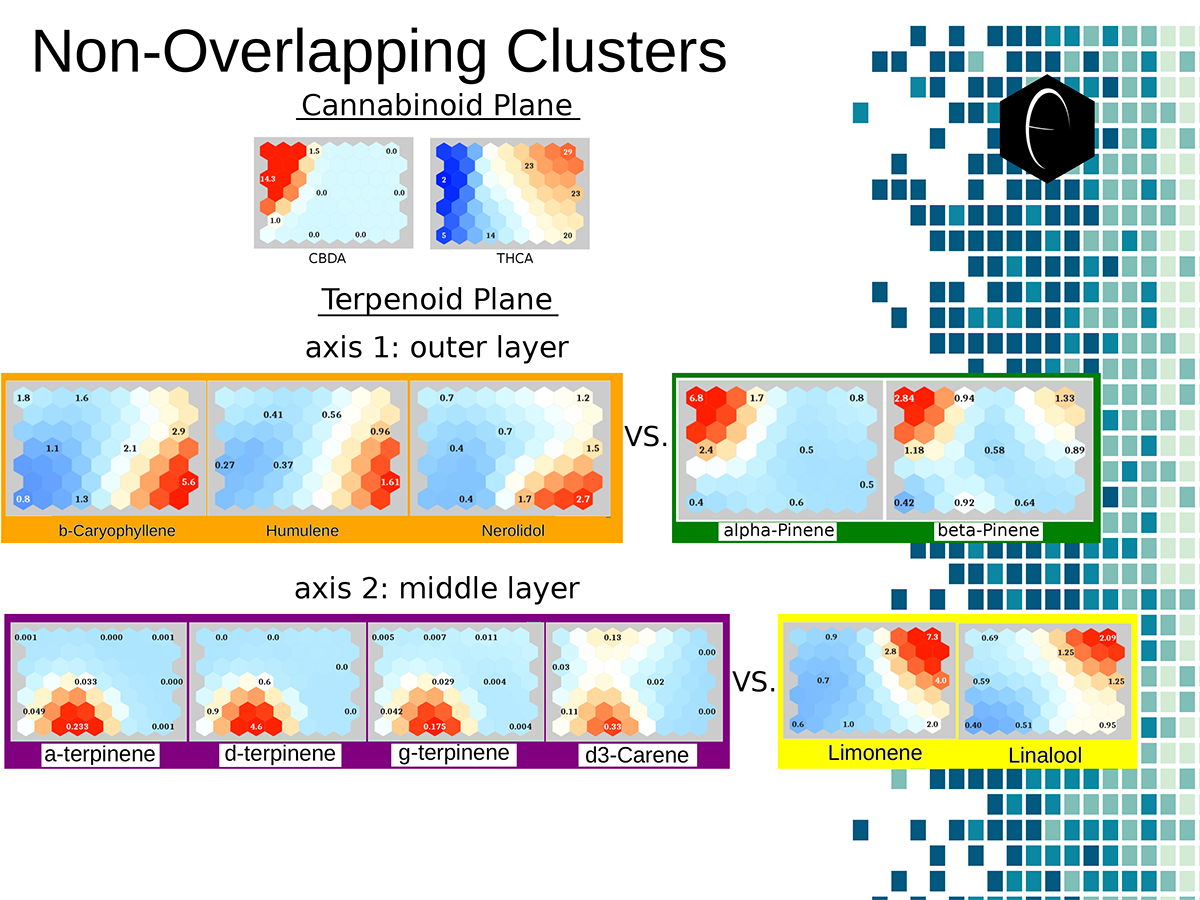 Illustration of two planes of cannabis data illustrated as self-organizing maps. The first plane shows only two components, CBDA and THCA. The second plane shows several terpene components which are grouped into opposing or non-overlapping clusters.
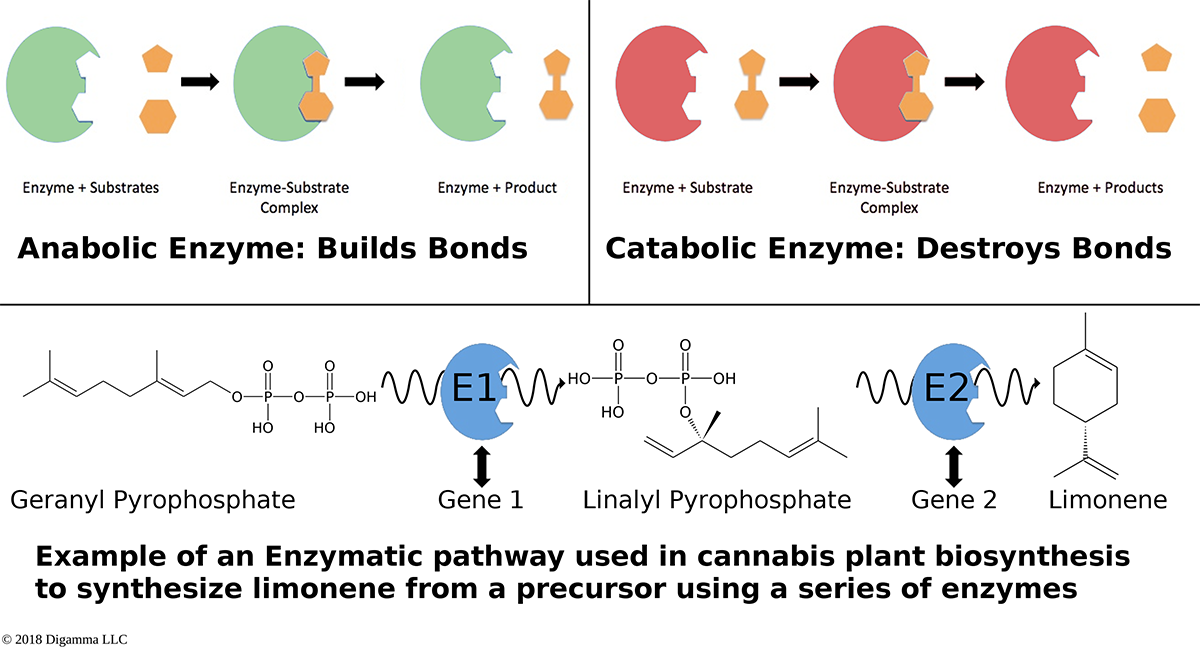 An overview of how enzymes mediate reactions that occur during biosynthesis. Clockwise from top-left: A scheme for an anabolic enzyme that builds chemical bonds; a scheme for a catabolic enzyme that destroys chemical bonds; and an example of a biosynthetic enzyme-mediated pathway of limonene.
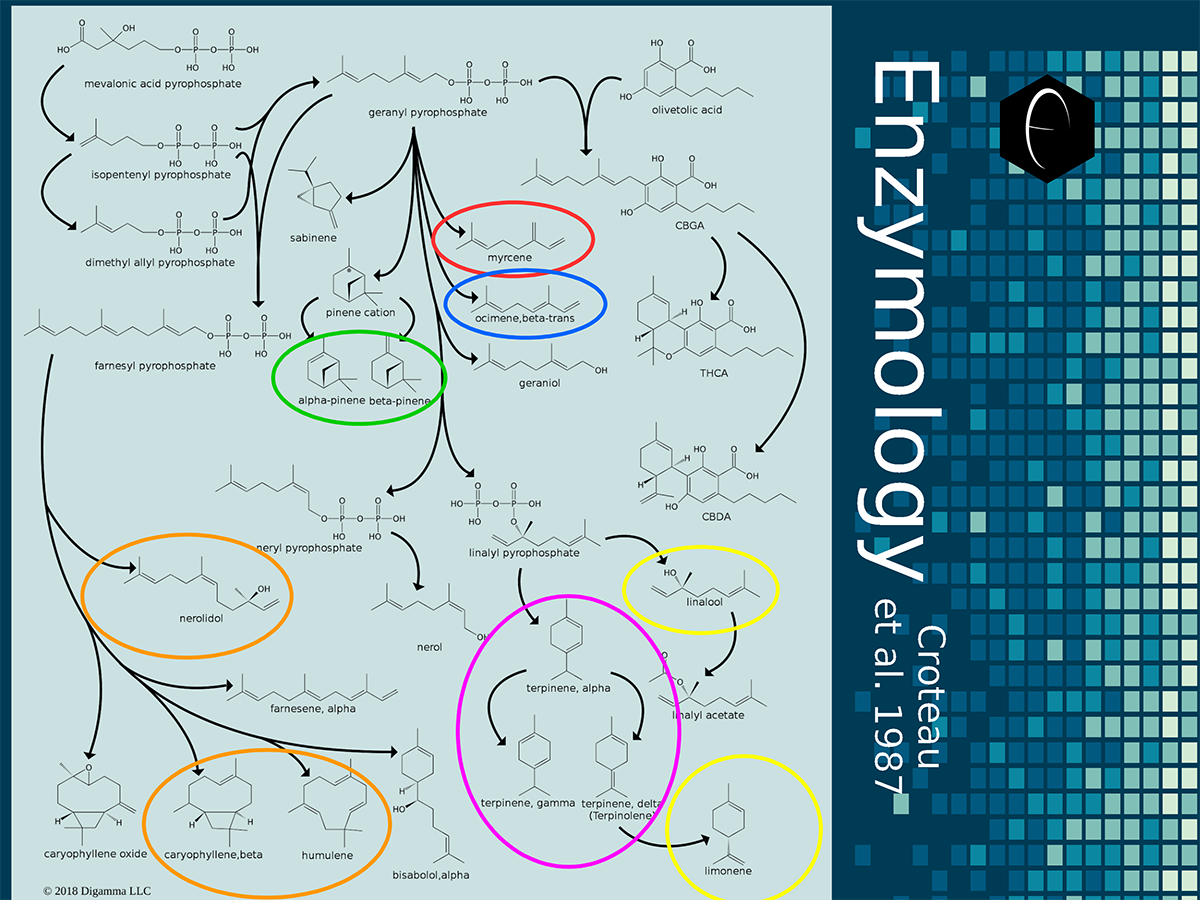
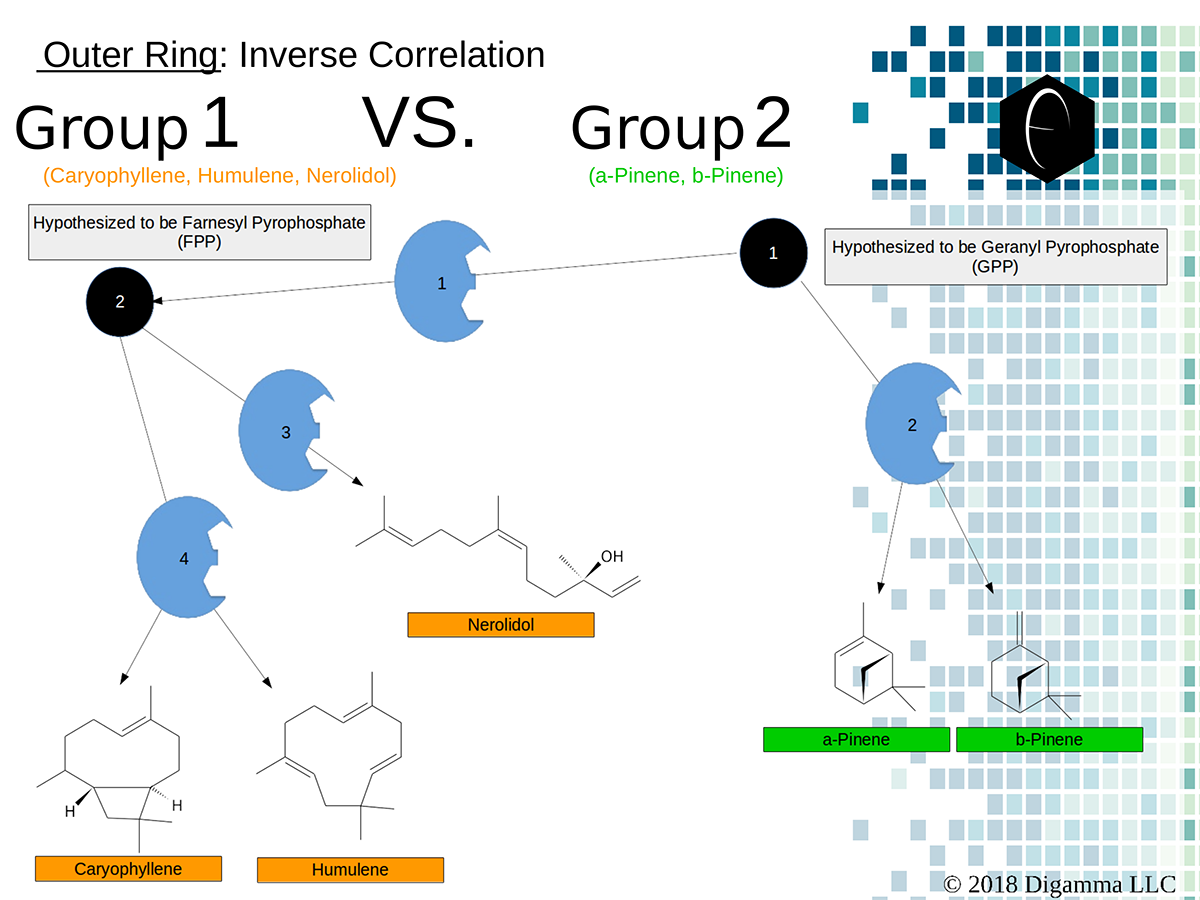 Enzymology mapping of the relationship between the outer-ring groups 1 and 2. Intermediates illustrated as black circles, and enzymes are indicated in blue. Terpenes are indicated by major group color.
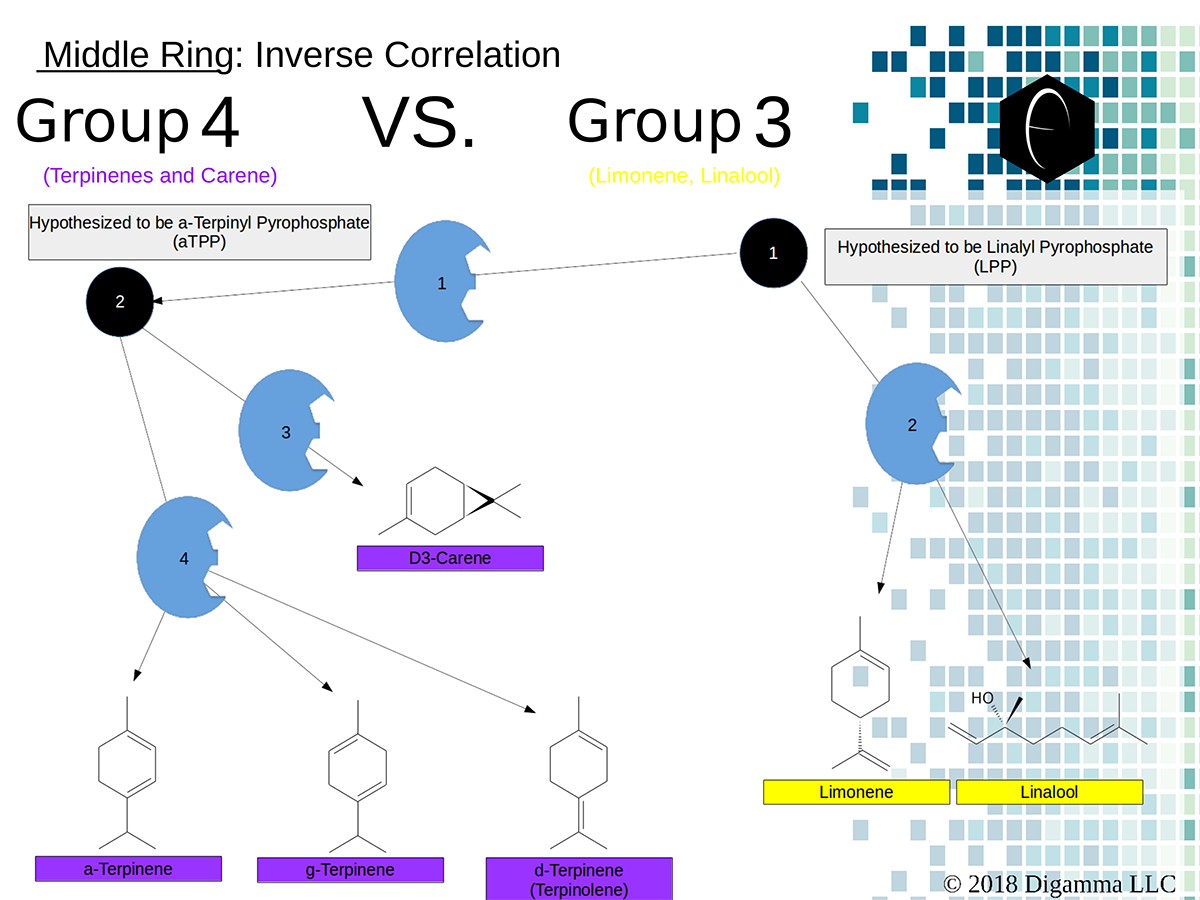 Enzymology mapping of the relationship between the middle-ring groups 4 and 3. Intermediates illustrated as black circles, and enzymes are indicated in blue. Terpenes are indicated by major group color.
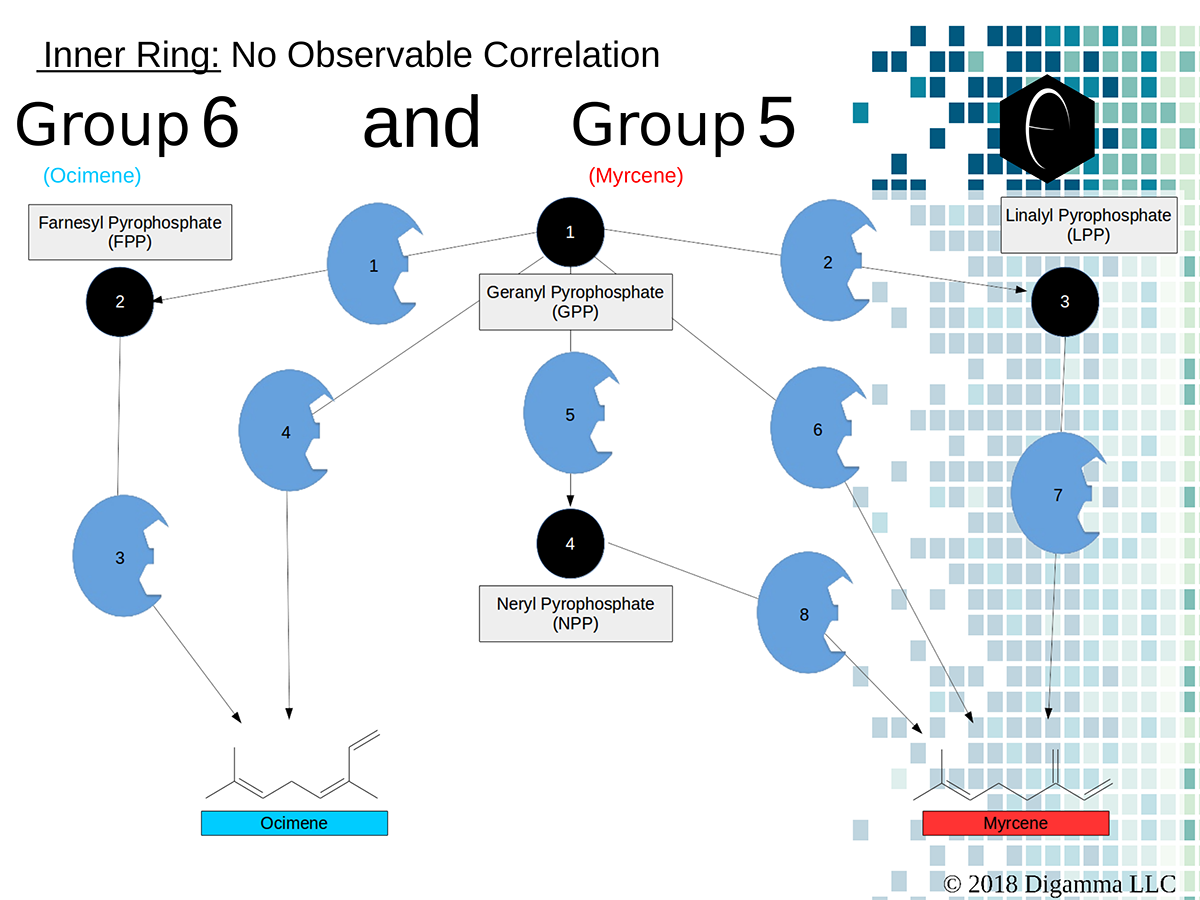 Enzymology mapping of the relationship between the inner-ring groups 6 and 5. Intermediates illustrated as black circles, and enzymes are indicated in blue. Terpenes are indicated by major group color.
References
- Russo, Ethan B. "Taming THC: potential cannabis synergy and phytocannabinoid‐terpenoid entourage effects." British journal of pharmacology 163.7 (2011): 1344-1364.
- Russo, Ethan B., and John M. McPartland. "Cannabis is more than simply Δ 9-tetrahydrocannabinol." Psychopharmacology 165.4 (2003): 431-432.
- What is Cannabidiol? | Project CBD - https://www.projectcbd.org/science/terpenes/terpenes-and-entourage-effect
- CNN | Dr. Sanjay Gupta - https://edition.cnn.com/2014/03/11/health/gupta-marijuana-entourage/
- McPartland, John M., and Ethan B. Russo. "Cannabis and cannabis extracts: greater than the sum of their parts?." Journal of Cannabis Therapeutics 1.3-4 (2001): 103-132.
- Croteau, Rodney. "Biosynthesis and catabolism of monoterpenoids." Chemical Reviews 87.5 (1987): 929-954.
10 Best Gift Ideas for Cannabis Connoisseurs and Growing Aficionados (2022)
December 7, 2022Developing and Optimizing a Cannabis Cultivation System
December 14, 2021Dealing with Insomnia: How Can CBD Help?
December 10, 2020Your Guide to Sleep and CBD
December 7, 2020
Do you want to receive the next Grower's Spotlight as soon as it's available? Sign up below!
Resources:
Want to get in touch with Marco? He can be reached via the following methods:
- Website: https://www.digammaconsulting.com/
- Email: marco@digammaconsulting.com

Do you have any questions or comments?
About the Author
Digamma Consulting is a full-service laboratory and consulting firm for cannabis. Savino Sguera and Marco Troiani are leading partners for Digamma and have years of experience under their belts. Their market analyses and scientific insights have been well-received here at Growers Network.