
The following is an article produced by a contributing author. Growers Network does not endorse nor evaluate the claims of our contributors, nor do they influence our editorial process. We thank our contributors for their time and effort so we can continue our exclusive Growers Spotlight service.
In this series, we’ll be diving into the data from the Cannabiz Media License Database to learn what’s happening in California, now that we’re a couple of months into the state’s adult-use marijuana industry launch. As the fourth largest economy in the world and with an adult population of over 23.1 million people, the California marijuana market is expected to grow to $7 billion. Let’s see what’s been happening since January 1, 2018.
California Marijuana Regulators
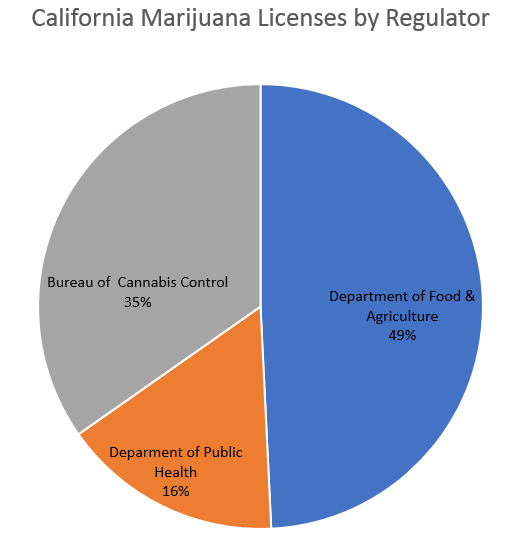
The rules and regulations of the California marijuana industry are controlled by three different agencies:
- The Department of Food and Agriculture licenses cultivators of both medical and recreational marijuana.
- The Department of Public Health licenses manufacturers of cannabis-infused edibles for medical and recreational use.
- The Bureau of Cannabis Control licenses retailers, distributors, testing labs, and microbusinesses.
With the launch of the adult-use marijuana industry in California, the percentage of licenses issued by each agency has changed. In January, the Bureau of Cannabis Control had issued the most licenses (49%), but now, the agency is only responsible for 35% of the issued licenses. On the other hand, the Department of Food and Agriculture only issued 27% of licenses in January, but now, that percentage has grown to 49%. The percentage of licenses issued by the Department of Public Health has decreased since January from 24% to 16% currently.
With three different agencies involved in creating the rules and regulations for California’s marijuana industry, there is a great deal of regulatory complexity that companies trying to get licenses have to navigate through. The barriers to entry are high (pun not intended) in California, and those companies who have strong regulatory expertise from lawyers and consultants will likely fare best under this scheme.
The California Marijuana Licenses
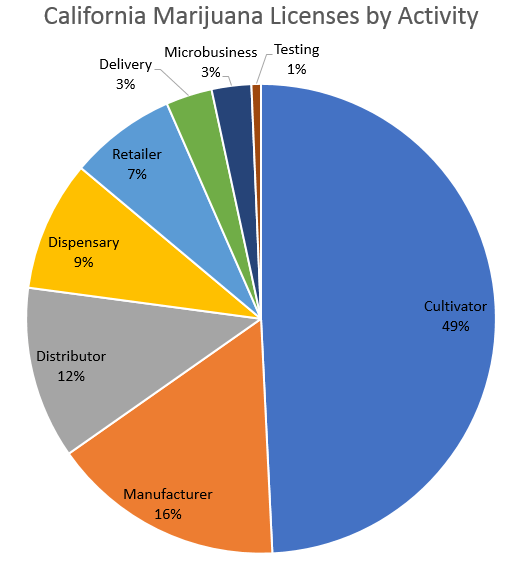
Cannabiz Media is tracking over 3,500 marijuana licenses in California. At the end of January 2018, just over 2,000 California licenses were being tracked, so the number of licenses in the state is increasing quickly. California now has more active licenses than any other state, and they’ve been issuing licenses for fewer than 90 days. In total, 65% of the marijuana licenses in California are medical (2,288) and 35% are adult-use (1,256). The current total is 3,518, and the breakdown by type of license in the state is as follows:
- Cultivator: 1,732 licenses (49%)
- Manufacturer: 564 licenses (16%)
- Distributor: 417 licenses (12%)
- Dispensary: 316 licenses (9%)
- Retailer: 258 licenses (7%)
- Delivery: 112 licenses (3%)
- Microbusiness: 96 licenses (3%)
- Testing: 23 licenses (1%)
Key Facts about California Marijuana Licenses
Reviewing the data in the Cannabiz Media Licensing Database revealed some interesting facts about California marijuana licenses that help to paint the picture of how the state’s marijuana marketplace is developing. Here are some of those key facts:
- 13 companies account for 10% of the licenses statewide.
- The company with the most licenses is Central Coast Farmer’s Market Management, LLC with 106. That’s 3% of all licenses in the state.
- There are 1,780 license holders in total in California.
- 15 jurisdictions account for half (51%) of all licenses:
- Oakland
- Los Angeles
- Sacramento
- San Francisco
- Carpinteria
- Salinas
- Buellton
- Eureka
- San Jose
- Arcata
- Santa Barbara
- Cathedral City
- Desert Hot Springs
- Lynwood
- Santa Rosa
- 1 jurisdiction accounts for nearly 1 in 10 licenses in the state – Oakland (282 licenses, 9%).
- Three jurisdictions account for nearly 20% of licenses in the state – Oakland (282 licenses), Los Angeles (203 licenses), and Sacramento (139 licenses).
- Many license holders seem to be acquiring multiple cultivation licenses.
- Just under 900 companies have secured the 1,732 cultivation licenses.
Based on these facts, it’s clear that a few areas in California are becoming marijuana hot beds and a small number of companies are positioned to dominate the industry. Stay tuned for Part 2 of the Marijuana Licenses in California series. In that post, we’ll dive into cultivation licenses.
Resources:
Want to get in touch with Cannabiz Media? They can be reached via the following methods:
- Website: https://cannabiz.media/
- Phone: 203-653-7975
- Email: info@cannabiz.media
